This whitepaper is for historical reference only. Some content might be outdated and some links might not be available.
ML Platform Monitoring
ML Platform needs to be monitored for job status (such as training job failure/success), platform health (such as CPU / memory usage), and various metrics (such as inference error rates, data drift, and training loss). There are three main areas of an ML platform that require monitoring:
-
Automation Pipeline
-
Model training
-
Production model serving
See the following figure for a sample monitoring architecture for the three monitoring areas:
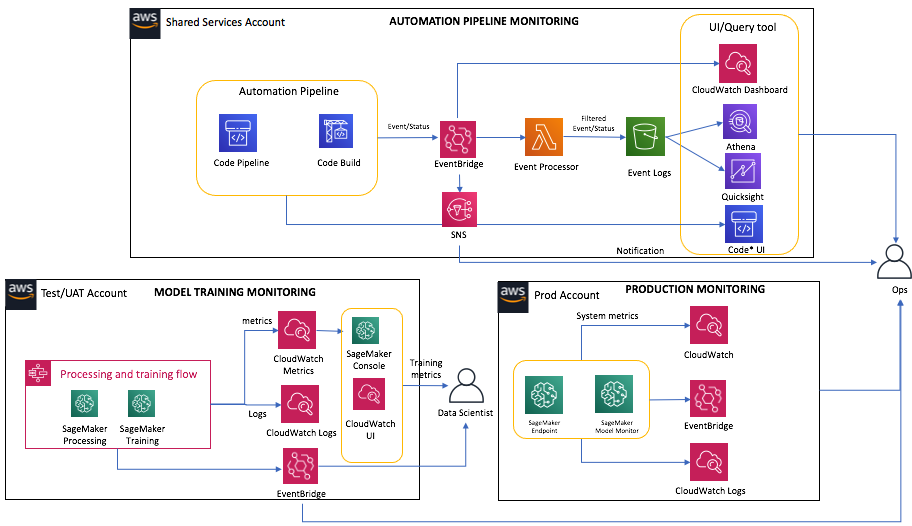
Sample ML platform monitoring architecture
Automation pipeline monitoring
Sample ML platform monitoring architecture
You can configure your AWS environment to monitor automation pipelines for pipeline status, and trigger notification when important events are detected. CodePipeline and CodeBuild provide event status on pipeline and build runs such as “in-progress” or “succeeded.” They also integrate with CloudWatch Events to log events to S3 for detailed analysis, or send out notifications via SNS service. For more information, see Monitoring pipelines and Monitoring AWS CodeBuild.
Model building monitoring
You can monitor the model building pipeline for training status and metric reporting. The various services used in the pipeline can provide job status and integrate with other AWS services such as CloudWatch, EventBridge, and CloudTrail to support data collection, analysis, and real-time notification. For example, Step Functions can report status such as Success, Failure, Canceled, or In-Progress during its run. SageMaker AI emits status change events for SageMaker AI labeling, training, hyperparameter tuning, process jobs, and inference endpoint. It also sends training metrics for built-in algorithms such as mean absolute error (MAE) and accuracy, and custom-defined metrics for custom models to CloudWatch Metrics and training logs to CloudWatch Logs. If real-time notification is needed, you can use EventBridge to send out notification or trigger additional workflows. For more information, see Monitor Amazon SageMaker AI and Monitoring Step Step Functions Using CloudWatch.
Production endpoint monitoring
You can monitor production endpoints for system health, data drift, model drift, data and model bias, and explanation for each prediction. SageMaker AI endpoint reports a set of system metrics such as CPU and memory utilization, model invocation metrics, model latency, and errors through CloudWatch. SageMaker AI Model Monitor can detect data/concept drift of models hosted by the SageMaker AI hosting service. For model drift detection, model metrics can be periodically evaluated using collected labeled data running against the hosted model.
