Monitoring an Amazon Aurora global database
When you create the Aurora DB clusters that make up your Aurora global database, you can choose many options that let you monitor your DB cluster's performance. These options include the following:
Amazon RDS Performance Insights – Enables performance schema in the underlying Aurora database engine. To learn more about Performance Insights and Aurora global databases, see Monitoring an Amazon Aurora global database with Amazon RDS Performance Insights.
Enhanced monitoring – Generates metrics for process or thread utilization on the CPU. To learn about enhanced monitoring, see Monitoring OS metrics with Enhanced Monitoring.
Amazon CloudWatch Logs – Publishes specified log types to CloudWatch Logs. Error logs are published by default, but you can choose other logs specific to your Aurora database engine.
For Aurora MySQL–based Aurora DB clusters, you can export the audit log, general log, and slow query log.
For Aurora PostgreSQL–based Aurora DB clusters, you can export the PostgreSQL log.
For Aurora MySQL–based global databases, you can query specific
information_schematables to check the status of your Aurora global database and its instances. To learn how, see Monitoring Aurora MySQL-based global databases.For Aurora PostgreSQL–based global databases, you can use specific functions to check the status of your Aurora global database and its instances. To learn how, see Monitoring Aurora PostgreSQL-based global databases.
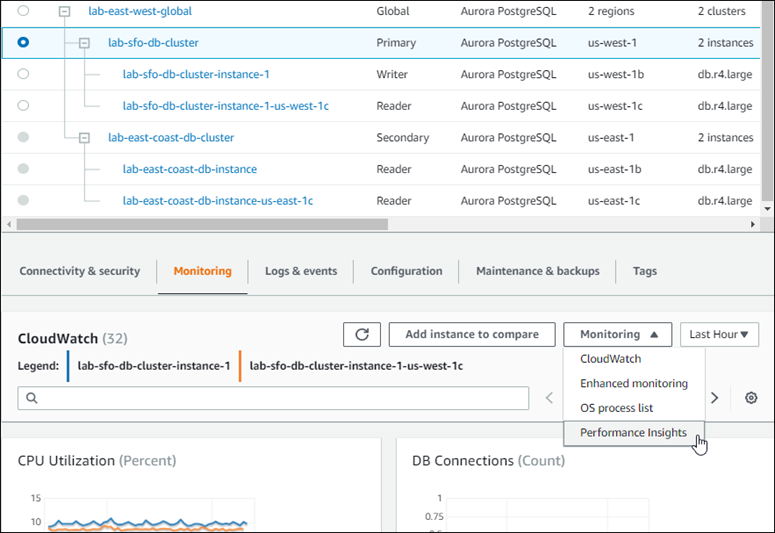
The following screenshot shows some of the options available on the Monitoring tab of a primary Aurora DB cluster in an Aurora global database.
For more information, see Monitoring metrics in an Amazon Aurora cluster.
Monitoring an Amazon Aurora global database with Amazon RDS Performance Insights
You can use Amazon RDS Performance Insights for your Aurora global databases. You enable this feature individually, for each Aurora DB cluster in your Aurora global database. To do so, you choose Enable Performance Insights in the Additional configuration section of the Create database page. Or you can modify your Aurora DB clusters to use this feature after they are up and running. You can enable or turn off Performance Insights for each cluster that's part of your Aurora global database.
The reports created by Performance Insights apply to each cluster in the global database. When you add a new secondary AWS Region to an Aurora global database that's already using Performance Insights, be sure that you enable Performance Insights in the newly added cluster. It doesn't inherit the Performance Insights setting from the existing global database.
You can switch AWS Regions while viewing the Performance Insights page for a DB instance that's attached to a global database. However, you might not see performance information immediately after switching AWS Regions. Although the DB instances might have identical names in each AWS Region, the associated Performance Insights URL is different for each DB instance. After switching AWS Regions, choose the name of the DB instance again in the Performance Insights navigation pane.
For DB instances associated with a global database, the factors affecting performance might be different in each AWS Region. For example, the DB instances in each AWS Region might have different capacity.
To learn more about using Performance Insights, see Monitoring DB load with Performance Insights on Amazon Aurora.
Monitoring Aurora global databases with Database Activity Streams
By using the Database Activity Streams feature, you can monitor and set alarms for auditing activity in the DB clusters in your global database. You start a database activity stream on each DB cluster separately. Each cluster delivers audit data to its own Kinesis stream within its own AWS Region. For more information, see Monitoring Amazon Aurora with Database Activity Streams.
Monitoring Aurora MySQL-based global databases
To view the status of an Aurora MySQL-based global database, query the information_schema.aurora_global_db_status and information_schema.aurora_global_db_instance_status tables.
Note
The information_schema.aurora_global_db_status and
information_schema.aurora_global_db_instance_status tables are only
available with Aurora MySQL version 3.04.0 and higher global databases.
To monitor an Aurora MySQL-based global database
-
Connect to the global database primary cluster endpoint using a MySQL client. For more information about how to connect, see Connecting to Amazon Aurora Global Database.
-
Query the
information_schema.aurora_global_db_statustable in a mysql command to list the primary and secondary volumes. This query returns the lag times of the global database secondary DB clusters, as in the following example.mysql> select * from information_schema.aurora_global_db_status;AWS_REGION | HIGHEST_LSN_WRITTEN | DURABILITY_LAG_IN_MILLISECONDS | RPO_LAG_IN_MILLISECONDS | LAST_LAG_CALCULATION_TIMESTAMP | OLDEST_READ_VIEW_TRX_ID -----------+---------------------+--------------------------------+------------------------+---------------------------------+------------------------ us-east-1 | 183537946 | 0 | 0 | 1970-01-01 00:00:00.000000 | 0 us-west-2 | 183537944 | 428 | 0 | 2023-02-18 01:26:41.925000 | 20806982 (2 rows)The output includes a row for each DB cluster of the global database containing the following columns:
-
AWS_REGION – The AWS Region that this DB cluster is in. For tables listing AWS Regions by engine, see Region availability.
-
HIGHEST_LSN_WRITTEN – The highest log sequence number (LSN) currently written on this DB cluster.
A log sequence number (LSN) is a unique sequential number that identifies a record in the database transaction log. LSNs are ordered such that a larger LSN represents a later transaction.
-
DURABILITY_LAG_IN_MILLISECONDS – The difference in the timestamp values between the
HIGHEST_LSN_WRITTENon a secondary DB cluster and theHIGHEST_LSN_WRITTENon the primary DB cluster. This value is always 0 on the primary DB cluster of the Aurora global database. -
RPO_LAG_IN_MILLISECONDS – The recovery point objective (RPO) lag. The RPO lag is the time it takes for the most recent user transaction COMMIT to be stored on a secondary DB cluster after it's been stored on the primary DB cluster of the Aurora global database. This value is always 0 on the primary DB cluster of the Aurora global database.
In simple terms, this metric calculates the recovery point objective for each Aurora MySQL DB cluster in the Aurora global database, that is, how much data might be lost if there were an outage. As with lag, RPO is measured in time.
-
LAST_LAG_CALCULATION_TIMESTAMP – The timestamp that specifies when values were last calculated for
DURABILITY_LAG_IN_MILLISECONDSandRPO_LAG_IN_MILLISECONDS. A time value such as1970-01-01 00:00:00+00means this is the primary DB cluster. -
OLDEST_READ_VIEW_TRX_ID – The ID of the oldest transaction that the writer DB instance can purge to.
-
-
Query the
information_schema.aurora_global_db_instance_statustable to list all secondary DB instances for both the primary DB cluster and the secondary DB clusters.mysql> select * from information_schema.aurora_global_db_instance_status;SERVER_ID | SESSION_ID | AWS_REGION | DURABLE_LSN | HIGHEST_LSN_RECEIVED | OLDEST_READ_VIEW_TRX_ID | OLDEST_READ_VIEW_LSN | VISIBILITY_LAG_IN_MSEC ---------------------+--------------------------------------+------------+-------------+----------------------+-------------------------+----------------------+------------------------ ams-gdb-primary-i2 | MASTER_SESSION_ID | us-east-1 | 183537698 | 0 | 0 | 0 | 0 ams-gdb-secondary-i1 | cc43165b-bdc6-4651-abbf-4f74f08bf931 | us-west-2 | 183537689 | 183537692 | 20806928 | 183537682 | 0 ams-gdb-secondary-i2 | 53303ff0-70b5-411f-bc86-28d7a53f8c19 | us-west-2 | 183537689 | 183537692 | 20806928 | 183537682 | 677 ams-gdb-primary-i1 | 5af1e20f-43db-421f-9f0d-2b92774c7d02 | us-east-1 | 183537697 | 183537698 | 20806930 | 183537691 | 21 (4 rows)The output includes a row for each DB instance of the global database containing the following columns:
-
SERVER_ID – The server identifier for the DB instance.
-
SESSION_ID – A unique identifier for the current session. A value of
MASTER_SESSION_IDidentifies the Writer (primary) DB instance. -
AWS_REGION – The AWS Region that this DB instance is in. For tables listing AWS Regions by engine, see Region availability.
-
DURABLE_LSN – The LSN made durable in storage.
-
HIGHEST_LSN_RECEIVED – The highest LSN received by the DB instance from the writer DB instance.
-
OLDEST_READ_VIEW_TRX_ID – The ID of the oldest transaction that the writer DB instance can purge to.
-
OLDEST_READ_VIEW_LSN – The oldest LSN used by the DB instance to read from storage.
-
VISIBILITY_LAG_IN_MSEC – For readers in the primary DB cluster, how far this DB instance is lagging behind the writer DB instance in milliseconds. For readers in a secondary DB cluster, how far this DB instance is lagging behind the secondary volume in milliseconds.
-
To see how these values change over time, consider the following transaction block where a table insert takes an hour.
mysql> BEGIN;
mysql> INSERT INTO table1 SELECT Large_Data_That_Takes_1_Hr_To_Insert;
mysql> COMMIT;
In some cases, there might be a network disconnect between the primary DB cluster and
the secondary DB cluster after the BEGIN statement. If so, the secondary DB
cluster's DURABILITY_LAG_IN_MILLISECONDS value starts
increasing. At the end of the INSERT statement, the
DURABILITY_LAG_IN_MILLISECONDS value is 1 hour. However, the
RPO_LAG_IN_MILLISECONDS value is 0 because all the user data
committed between the primary DB cluster and secondary DB cluster are still the same. As
soon as the COMMIT statement completes, the
RPO_LAG_IN_MILLISECONDS value increases.
Monitoring Aurora PostgreSQL-based global databases
To view the status of an Aurora PostgreSQL-based global database, use the aurora_global_db_status and
aurora_global_db_instance_status functions.
Note
Only Aurora PostgreSQL supports the aurora_global_db_status and
aurora_global_db_instance_status functions.
To monitor an Aurora PostgreSQL-based global database
-
Connect to the global database primary cluster endpoint using a PostgreSQL utility such as psql. For more information about how to connect, see Connecting to Amazon Aurora Global Database.
-
Use the
aurora_global_db_statusfunction in a psql command to list the primary and secondary volumes. This shows the lag times of the global database secondary DB clusters.postgres=> select * from aurora_global_db_status();aws_region | highest_lsn_written | durability_lag_in_msec | rpo_lag_in_msec | last_lag_calculation_time | feedback_epoch | feedback_xmin ------------+---------------------+------------------------+-----------------+----------------------------+----------------+--------------- us-east-1 | 93763984222 | -1 | -1 | 1970-01-01 00:00:00+00 | 0 | 0 us-west-2 | 93763984222 | 900 | 1090 | 2020-05-12 22:49:14.328+00 | 2 | 3315479243 (2 rows)The output includes a row for each DB cluster of the global database containing the following columns:
-
aws_region – The AWS Region that this DB cluster is in. For tables listing AWS Regions by engine, see Region availability.
-
highest_lsn_written – The highest log sequence number (LSN) currently written on this DB cluster.
A log sequence number (LSN) is a unique sequential number that identifies a record in the database transaction log. LSNs are ordered such that a larger LSN represents a later transaction.
-
durability_lag_in_msec – The timestamp difference between the highest log sequence number written on a secondary DB cluster (
highest_lsn_written) and thehighest_lsn_writtenon the primary DB cluster. -
rpo_lag_in_msec – The recovery point objective (RPO) lag. This lag is the time difference between the most recent user transaction commit stored on a secondary DB cluster and the most recent user transaction commit stored on the primary DB cluster.
-
last_lag_calculation_time – The timestamp when values were last calculated for
durability_lag_in_msecandrpo_lag_in_msec. -
feedback_epoch – The epoch a secondary DB cluster uses when it generates hot standby information.
Hot standby is when a DB cluster can connect and query while the server is in recovery or standby mode. Hot standby feedback is information about the DB cluster when it's in hot standby. For more information, see Hot standby
in the PostgreSQL documentation. -
feedback_xmin – The minimum (oldest) active transaction ID used by a secondary DB cluster.
-
-
Use the
aurora_global_db_instance_statusfunction to list all secondary DB instances for both the primary DB cluster and secondary DB clusters.postgres=> select * from aurora_global_db_instance_status();server_id | session_id | aws_region | durable_lsn | highest_lsn_rcvd | feedback_epoch | feedback_xmin | oldest_read_view_lsn | visibility_lag_in_msec --------------------------------------------+--------------------------------------+------------+-------------+------------------+----------------+---------------+----------------------+------------------------ apg-global-db-rpo-mammothrw-elephantro-1-n1 | MASTER_SESSION_ID | us-east-1 | 93763985102 | | | | | apg-global-db-rpo-mammothrw-elephantro-1-n2 | f38430cf-6576-479a-b296-dc06b1b1964a | us-east-1 | 93763985099 | 93763985102 | 2 | 3315479243 | 93763985095 | 10 apg-global-db-rpo-elephantro-mammothrw-n1 | 0d9f1d98-04ad-4aa4-8fdd-e08674cbbbfe | us-west-2 | 93763985095 | 93763985099 | 2 | 3315479243 | 93763985089 | 1017 (3 rows)The output includes a row for each DB instance of the global database containing the following columns:
-
server_id – The server identifier for the DB instance.
-
session_id – A unique identifier for the current session.
-
aws_region – The AWS Region that this DB instance is in. For tables listing AWS Regions by engine, see Region availability.
-
durable_lsn – The LSN made durable in storage.
-
highest_lsn_rcvd – The highest LSN received by the DB instance from the writer DB instance.
-
feedback_epoch – The epoch the DB instance uses when it generates hot standby information.
Hot standby is when a DB instance can connect and query while the server is in recovery or standby mode. Hot standby feedback is information about the DB instance when it's in hot standby. For more information, see the PostgreSQL documentation on Hot standby
. -
feedback_xmin – The minimum (oldest) active transaction ID used by the DB instance.
-
oldest_read_view_lsn – The oldest LSN used by the DB instance to read from storage.
-
visibility_lag_in_msec – How far this DB instance is lagging behind the writer DB instance.
-
To see how these values change over time, consider the following transaction block where a table insert takes an hour.
psql> BEGIN;
psql> INSERT INTO table1 SELECT Large_Data_That_Takes_1_Hr_To_Insert;
psql> COMMIT;
In some cases, there might be a network disconnect between the primary DB cluster and the
secondary DB cluster after the BEGIN statement. If so, the secondary DB
cluster's durability_lag_in_msec value starts increasing. At the end of the
INSERT statement, the durability_lag_in_msec value is 1 hour.
However, the rpo_lag_in_msec value is 0 because all the user data committed
between the primary DB cluster and secondary DB cluster are still the same. As soon as the
COMMIT statement completes, the rpo_lag_in_msec value increases.
