Configuring AWS X-Ray debugging
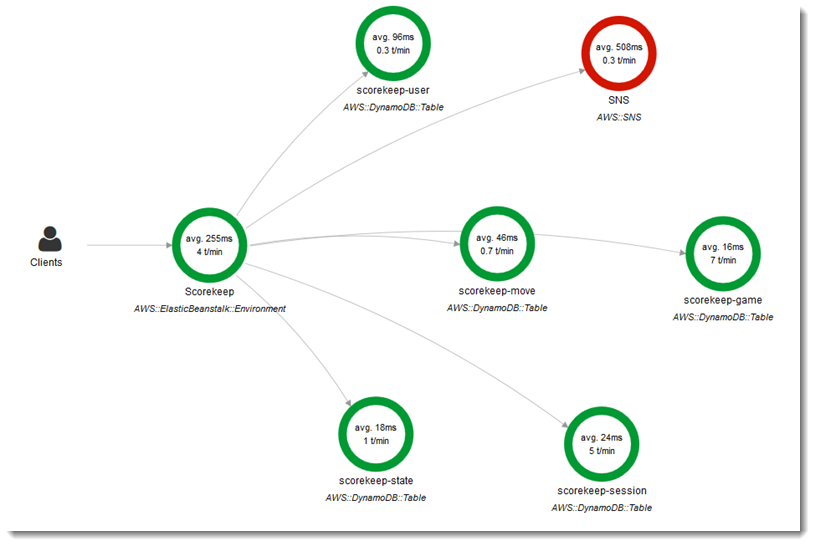
You can use the AWS Elastic Beanstalk console or a configuration file to run the AWS X-Ray daemon on the instances in your environment. X-Ray is an AWS service that gathers data about the requests that your application serves, and uses it to construct a service map that you can use to identify issues with your application and opportunities for optimization.
Note
Some regions don't offer X-Ray. If you create an environment in one of these regions, you can't run the X-Ray daemon on the instances in your environment.
For information about the AWS services offered in each Region, see
Region Table

X-Ray provides an SDK that you can use to instrument your application code, and a daemon application that relays debugging information from the SDK to the X-Ray API.
Supported platforms
You can use the X-Ray SDK with the following Elastic Beanstalk platforms:
-
Go - version 2.9.1 and later
-
Java 8 - version 2.3.0 and later
-
Java 8 with Tomcat 8 - version 2.4.0 and later
-
Node.js - version 3.2.0 and later
-
Windows Server - all platform versions released on or after December 18th, 2016
-
Python - version 2.5.0 and later
On supported platforms, you can use a configuration option to run the X-Ray daemon on the instances in your environment. You can enable the daemon in the Elastic Beanstalk console or by using a configuration file.
To upload data to X-Ray, the X-Ray daemon requires IAM permissions in the AWSXrayWriteOnlyAccess managed policy. These permissions are included in the Elastic Beanstalk instance profile. If you don't use the default instance profile, see Giving the Daemon Permission to Send Data to X-Ray in the AWS X-Ray Developer Guide.
Debugging with X-Ray requires the use of the X-Ray SDK. See the Getting Started with AWS X-Ray in the AWS X-Ray Developer Guide for instructions and sample applications.
If you use a platform version that doesn't include the daemon, you can still run it with a script in a configuration file. For more information, see Downloading and Running the X-Ray Daemon Manually (Advanced) in the AWS X-Ray Developer Guide.
Configuring debugging
You can enable the X-Ray daemon on a running environment in the Elastic Beanstalk console.
To enable debugging in the Elastic Beanstalk console
Open the Elastic Beanstalk console
, and in the Regions list, select your AWS Region. -
In the navigation pane, choose Environments, and then choose the name of your environment from the list.
In the navigation pane, choose Configuration.
-
In the Updates, monitoring, and logging configuration category, choose Edit.
-
In the Amazon X-Ray section, select Activated.
-
To save the changes choose Apply at the bottom of the page.
You can also enable this option during environment creation. For more information, see The create new environment wizard.
The aws:elasticbeanstalk:xray namespace
You can use the XRayEnabled option in the
aws:elasticbeanstalk:xray namespace to enable debugging.
To enable debugging automatically when you deploy your application, set the option in a configuration file in your source code, as follows.
Example .ebextensions/debugging.config
option_settings:
  aws:elasticbeanstalk:xray:
    XRayEnabled: true