OS monitoring
A DB instance in Amazon RDS for MySQL or MariaDB runs on the Linux operating system, which uses underlying system resources: CPU, memory, network and storage.
MySQL [(none)]> SHOW variables LIKE 'version%';
+-------------------------+---------------------+
| Variable_name           | Value               |
+-------------------------+---------------------+
| version                 | 8.0.28              |
| version_comment         | Source distribution |
| version_compile_machine | aarch64             |
| version_compile_os      | Linux               |
| version_compile_zlib    | 1.2.11              |
+-------------------------+---------------------+
5 rows in set (0.00 sec)
The overall performance of your database and the underlying operating system strongly depend on the utilization of system resources. For example, the CPU is the key component to the performance of your system, because it runs the database software instructions and manages other system resources. If the CPU is over-utilized (that is, if the load requires more CPU power than was provisioned for your DB instance), this issue would impact the performance and the stability of your database and consequently your application.
The database engine dynamically allocates and frees memory. When there is not enough memory
in the RAM to do the current work, the system writes memory pages to the swap memory, which
resides on the disk. Because the disk is much slower than memory, even if the disk is based on
SSD NVMe technology, excessive allocation of memory leads to performance degradation. High
memory utilization causes increased latency of database responses, because the size of a page
file grows to support additional memory. If the memory allocation is so high that it depletes
both the RAM and the swap memory spaces, the database service might become unavailable and
users could observe errors such as [ERROR] mysqld: Out of memory (Needed xyz
bytes).
MySQL and MariaDB database management systems utilize the storage subsystem, which consists
of disks that store on-disk
structuresOS error code 28: No space left on
device can cause unavailability and corruption of the database.
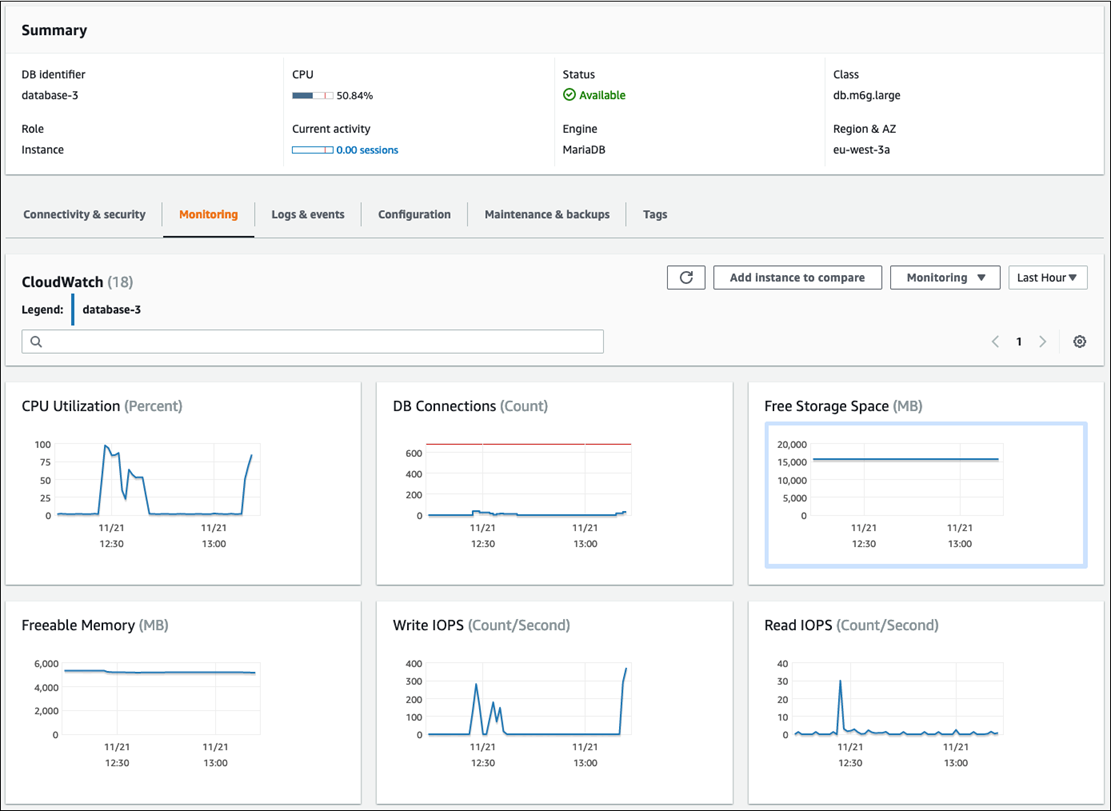
Amazon RDS provides metrics in real time for the operating system that your DB instance runs on. Amazon RDS automatically publishes one set of OS metrics to CloudWatch. Those metrics are available to you for display and analysis in the Amazon RDS console and the CloudWatch dashboards, and you can set alarms on the selected metrics in CloudWatch. Examples include:
-
CPUUtilization– The percentage of CPU utilization. -
BinLogDiskUsage– The amount of disk space that's occupied by binary logs. -
FreeableMemory– The amount of available random access memory. This represents the value of theMemAvailablefield of/proc/meminfo. -
ReadIOPS– The average number of disk read I/O operations per second. -
WriteThroughput– The average number of bytes written to disk per second for local storage. -
NetworkTransmitThroughput– The outgoing network traffic on the DB node, which combines both the database traffic and Amazon RDS traffic used for monitoring and replication.
For a complete reference of all metrics that are published by Amazon RDS to CloudWatch, see Amazon CloudWatch metrics for Amazon RDS in the Amazon RDS documentation.
The following chart shows examples of CloudWatch metrics for Amazon RDS that are displayed on the Amazon RDS console.
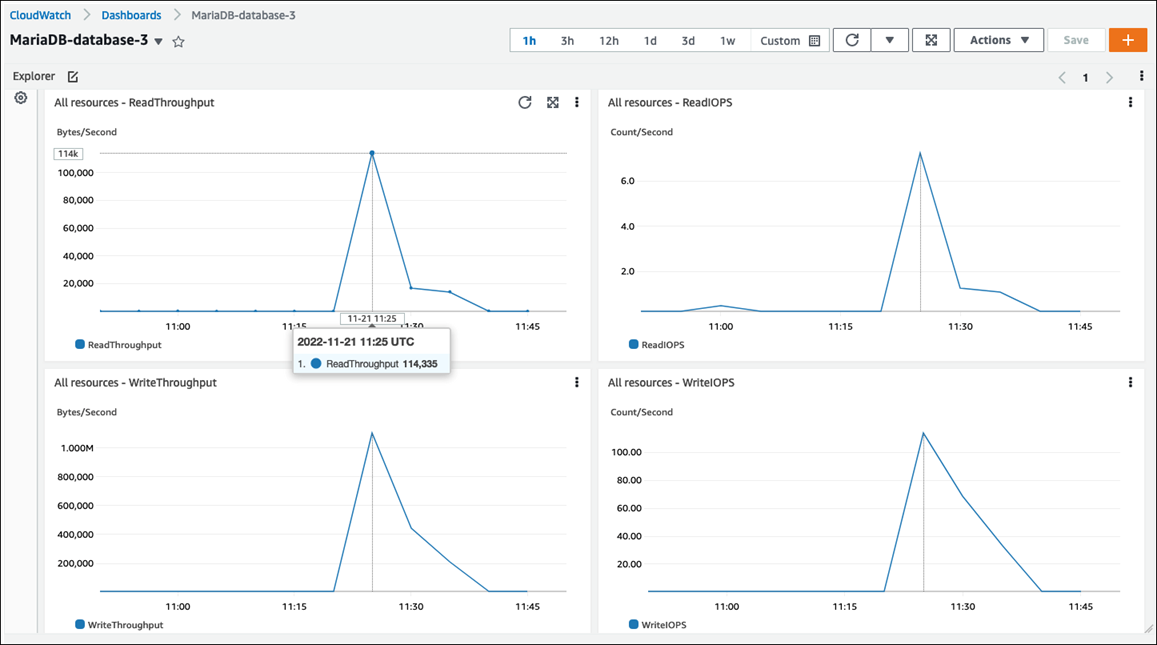
The following chart shows similar metrics displayed in the CloudWatch dashboard.
The other set of OS metrics is collected by Enhanced Monitoring for Amazon RDS. This tool gives you deeper visibility into the health of your Amazon RDS for MariaDB and Amazon RDS for MySQL DB instances, by providing real-time system metrics and OS process information. When you enable Enhanced Monitoring on your DB instance and set the desired granularity, the tool collects the operating system metrics and process information, which you can display and analyze on the Amazon RDS console, as shown in the following screen.
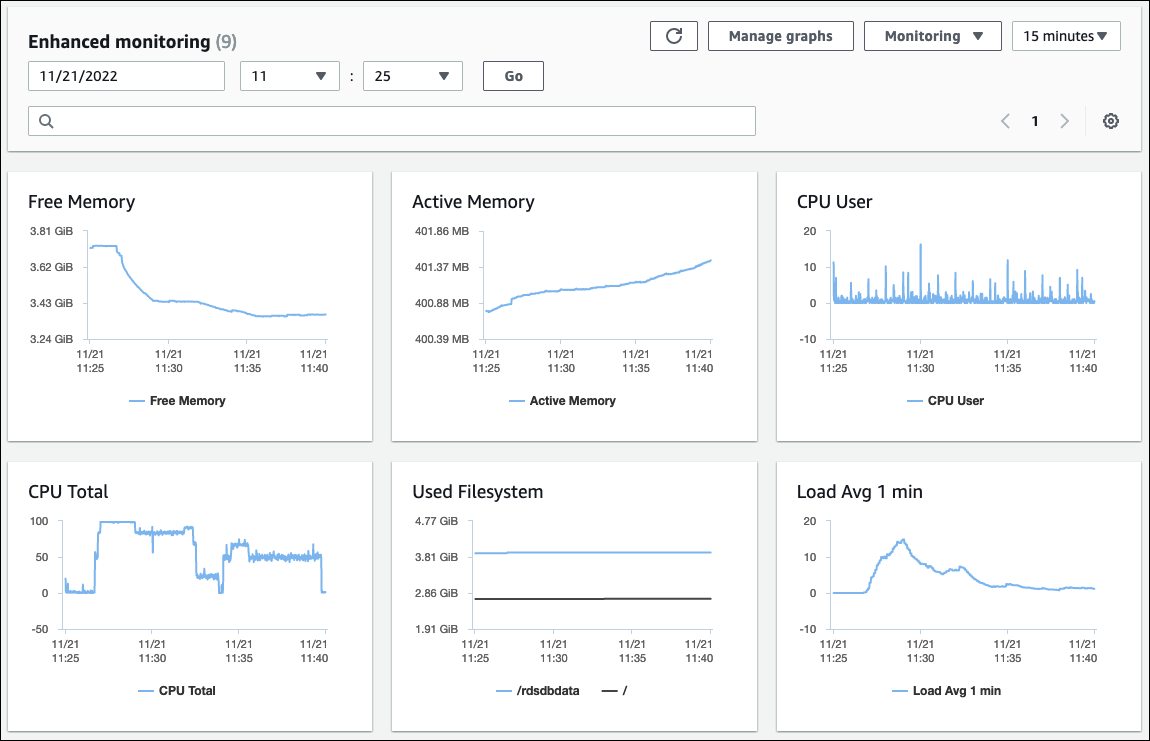
Some of the key metrics provided by Enhanced Monitoring are:
-
cpuUtilization.total– The total percentage of the CPU in use. -
cpuUtilization.user– The percentage of CPU in use by user programs. -
memory.active– The amount of assigned memory, in kilobytes. -
memory.cached– The amount of memory used for caching file system-based I/O. -
loadAverageMinute.one– The number of processes that requested CPU time during the last minute.
For a complete list of metrics, see OS metrics in Enhanced Monitoring in the Amazon RDS documentation.
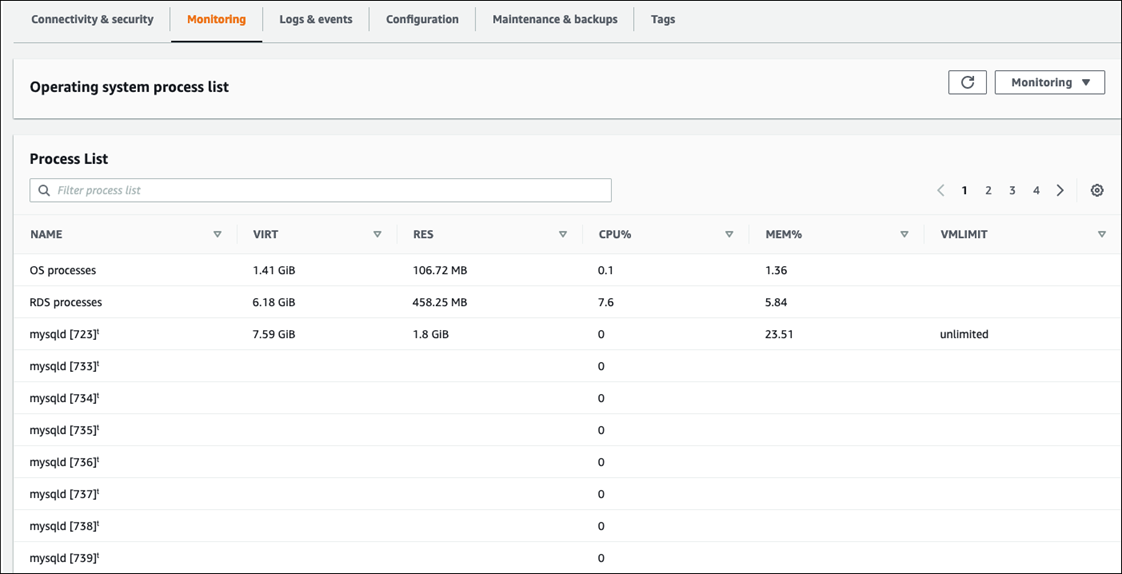
On the Amazon RDS console, the OS process list provides details for each process that's running in your DB instance. The list is organized into three sections:
-
OS processes ‒ This section represents an aggregated summary of all kernel and system processes. These processes generally have minimal impact on database performance.
-
RDS processes – This section represents a summary of the AWS processes that are required to support an Amazon RDS DB instance. For example, it includes the Amazon RDS management agent, monitoring and diagnostics processes, and similar processes.
-
RDS child processes – This section represents a summary of the Amazon RDS processes that support the DB instance―in this case, the
mysqldprocess and its threads. Themysqldthreads appear nested beneath the parentmysqldprocess.
The following screen illustration shows the OS process list in the Amazon RDS console.
Amazon RDS delivers the metrics from Enhanced Monitoring into your CloudWatch Logs account. The monitoring data that is shown on the Amazon RDS console is retrieved from CloudWatch Logs. You can also retrieve the metrics for a DB instance as a log stream from CloudWatch Logs. These metrics are stored in JSON format. You can consume the Enhanced Monitoring JSON output from CloudWatch Logs in a monitoring system of your choice.
In order to display graphs on the CloudWatch dashboard and create alarms that would initiate an
action if a metric breaches the defined threshold, you must create metric filters in CloudWatch from
CloudWatch Logs. For detailed instructions, see the AWS re:Post
article
The following example illustrates the custom metric CPU.User in the
Custom/RDS namespace. This custom metric is created by filtering the
cpuUtilization.user Enhanced Monitoring metric from CloudWatch Logs.
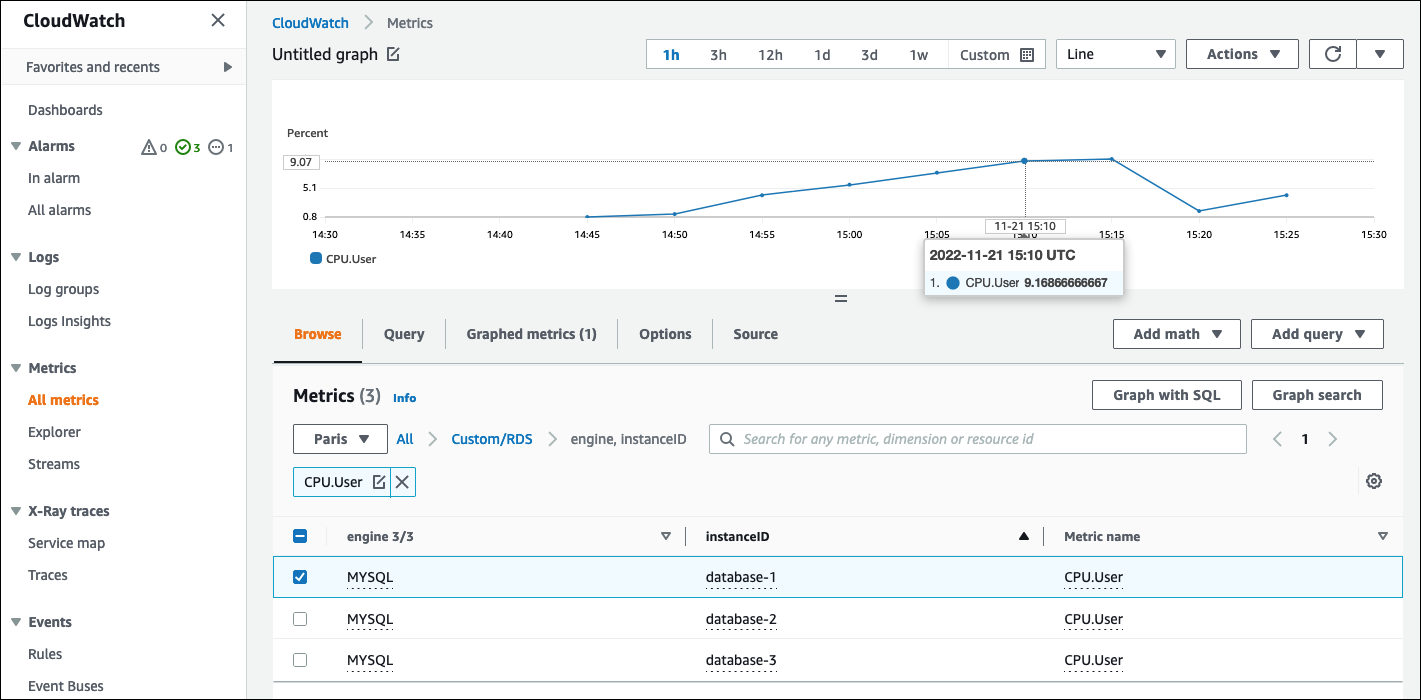
When the metric is available in the CloudWatch repository, you can display and analyze it in CloudWatch dashboards, apply further math and query operations, and set an alarm to monitor this specific metric and generate alerts if the observed values are not in line with the defined alarm conditions.
