Monitoring environment health in the AWS management console
You can access operational information about your application from the Elastic Beanstalk console. The console displays your environment's status and application health at a glance. In the console's Environments page and in each application's page, the environments on the list are color-coded to indicate status.
To monitor an environment in the Elastic Beanstalk console
Open the Elastic Beanstalk console
, and in the Regions list, select your AWS Region. -
In the navigation pane, choose Environments, and then choose the name of your environment from the list.
-
In the navigation pane, choose Monitoring.
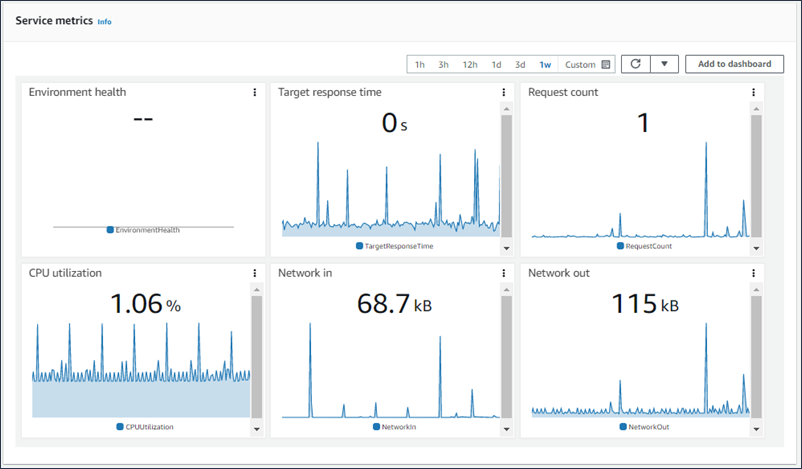
The Monitoring page shows you overall statistics about your environment, such as CPU utilization and average latency. In addition to the overall statistics, you can view monitoring graphs that show resource usage over time. You can click any of the graphs to view more detailed information.
Note
By default, only basic CloudWatch metrics are enabled, which return data in five-minute periods. You can enable more granular one-minute CloudWatch metrics by editing your environment's configuration settings.
Monitoring graphs
The Monitoring page shows an overview of health-related metrics for your environment. This includes the default set of metrics provided by Elastic Load Balancing and Amazon EC2, and graphs that show how the environment's health has changed over time.
The bar above the graphs provides a variety of time intervals for you to select. For example, select 1w to display information that spans over the last week. Or select 3h to display information that spans over the last three hours.
For a greater variety of time interval selections, choose Custom. From here you have two range options: Absolute or Relative. The Absolute option allows you to specify a specific date range, such as January 1, 2023 to June 30, 2023. The Relative option allows to select an integer with a specific time unit: Minutes, Hours, Days, Weeks, or Months. Examples include 10 Hours, 10 Days, and 10 Months.
Customizing the monitoring console
To create and view custom metrics you must use Amazon CloudWatch. With CloudWatch you can create custom dashboards to monitor your resources in a single view. Select Add to dashboard to navigate to the Amazon CloudWatch console from the Monitoring page. Amazon CloudWatch provides you the option to create a new dashboard or select an existing one. For more information, see Using Amazon CloudWatch dashboards in the Amazon CloudWatch User Guide.
Elastic Load Balancing and Amazon EC2 metrics are enabled for all environments.
With enhanced health, the EnvironmentHealth metric is enabled, and a graph is added to the monitoring console automatically. Enhanced health also adds the Health page to the management console. For a list of available enhanced health metrics, see Publishing Amazon CloudWatch custom metrics for an environment.
