Dashboards
Foundational
Most popular dashboards based on AWS Cost And Usage Report. These dashboards are recommended to start with.
|
Dashboard |
Preview |
Links |
Target Audience |
|
CUDOS Dashboard provides you high level details and operational insights with ability to drill down to resource level granularity. In CUDOS dashboard you can find auto-generated cost optimization recommendations and actionable insights which can be used by your FinOps practitioners, Product Owners and Engineering teams out of the box. It allows you to quickly identify spikes and uncover uncertainties in your AWS usage with highlighting particular resources which can be optimized. |
|
Product owners, Finance, FinOps, DevOps, Engineering teams |
|
|
Cost Intelligence Dashboard is a customizable and accessible dashboard to help create the foundation of your own cost management and optimization (FinOps) tool. Executives, directors, and other individuals within the CFO’s line of business or who manage cloud financials for an organization will find the Cloud Intelligence Dashboard easy to use and relevant to their use cases. Little to no technical knowledge or understanding of AWS Services is required |
|
Executives, Finance/Procurement |
|
|
The KPI and Modernization Dashboard helps your organization combine DevOps and IT infrastructure with Finance and the C-Suite to grow more efficiently and effectively on AWS. This dashboard lets you set and track modernization and optimization goals such as percent OnDemand, Spot adoption, and Graviton usage. By enabling every line of business to create and track usage goals, and your cloud center of excellence to make recommendations organization-wide, you can grow more efficiently and innovate more quickly on AWS |
|
Product owners, Finance, FinOps, DevOps, Engineering teams |


Advanced
Dashboards that require advanced Data Collection Stack.
|
Dashboard |
Preview |
Links |
Target Audience |
|
Trusted Advisor Organizational (TAO) Dashboard provides you visibility for all cost optimization opportunities and auto-identified idle resources together with highlighted by AWS Trusted Advisor risks and flagged resources across Security, Reliability and Performance pillars. TAO provides historical trends allowing you to track results of optimizations |
|
Product owners, FinOps, DevOps, Engineering, SRE, Security teams |
|
|
Compute Optimizer Dashboard helps your organization to visualize and trace right sizing recommendations from AWS Compute Optimizer. These recommendations will help you identify Cost savings opportunities for over provisioned resources and also see the Operational risk from under provisioned ones |
|
Product owners, FinOps, DevOps, Engineering teams |
|
|
Cost Anomaly Dashboard helps you to track and visualize findings from AWS Cost Anomaly Detection. |
|
Product owners, FinOps, DevOps, Engineering teams |
|
|
Extended Support Cost Projection helps you visualize the cost projection for RDS and EKS Extended Support charges based on your current resource usage. |
|
Product owners, FinOps, DevOps, Engineering teams |
|
|
Graviton Savings Dashboard helps you to quantify your Graviton opportunities and existing usage for EC2, RDS, OpenSearch, and ElastiCache Services. |
|
Product owners, FinOps, DevOps, Engineering teams |
|
|
Health Events Dashboard helps you to track past, current and upcoming events that are published to your Personal Health Dashboard. |
|
Product owners, DevOps, Engineering, SRE, Security teams |
|
|
AWS News Feeds displays several AWS Feeds including What’s New, Blog Post, Videos and Security Bulletins. |
|
Product owners, FinOps, DevOps, Engineering teams |
|
|
AWS Budgets Dashboard helps you plan and track your cloud spending across the organization. |
|
Product owners, FinOps, DevOps, Engineering teams |
|
|
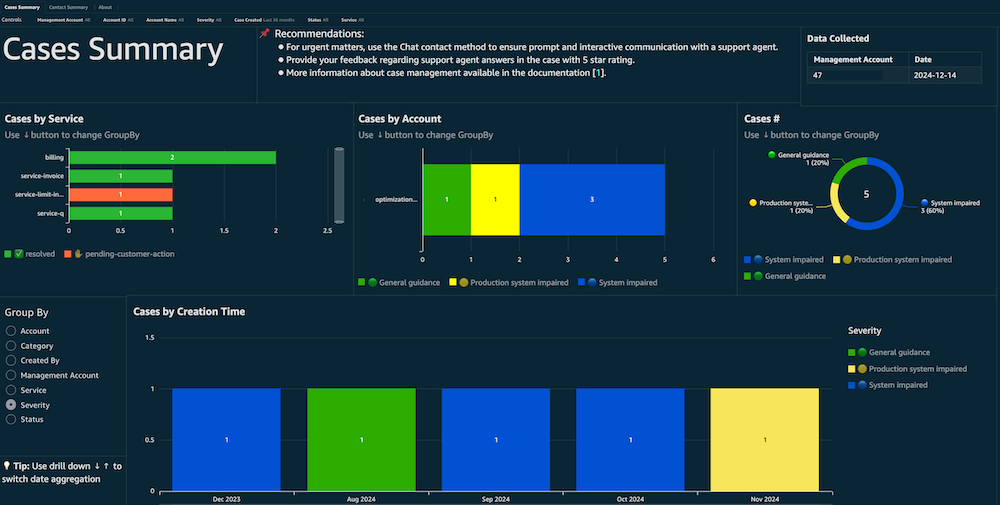
AWS Support Cases Radar Dashboard allows you to consolidate, track and analyze AWS Support cases across all linked accounts and multiple AWS organizations in a single place. With the optional Summarization plugin, powered by Amazon Bedrock, the dashboard can also provide executive summaries of case communications, presenting the issue, actions and outcomes in a clear and concise manner. |
|
Product owners, FinOps, DevOps, Engineering, CCOE, Security teams |
|
|
ResilienceVue Dashboard provides you visibility into your current AWS workloads resiliency assessed by AWS Resilience Hub. ResilienceVue helps you view the resilience posture for your applications within AWS Organization across AWS accounts and regions. |
|
Product owners, DevOps, Engineering, SRE, Security teams |
|
|
AWS End User Computing (EUC) Dashboard provides insights into your Amazon WorkSpaces usage, costs, and performance metrics. It helps you optimize your WorkSpaces deployment and understand user behavior patterns. |
|
IT Administrators, FinOps, Product Owners |
|
|
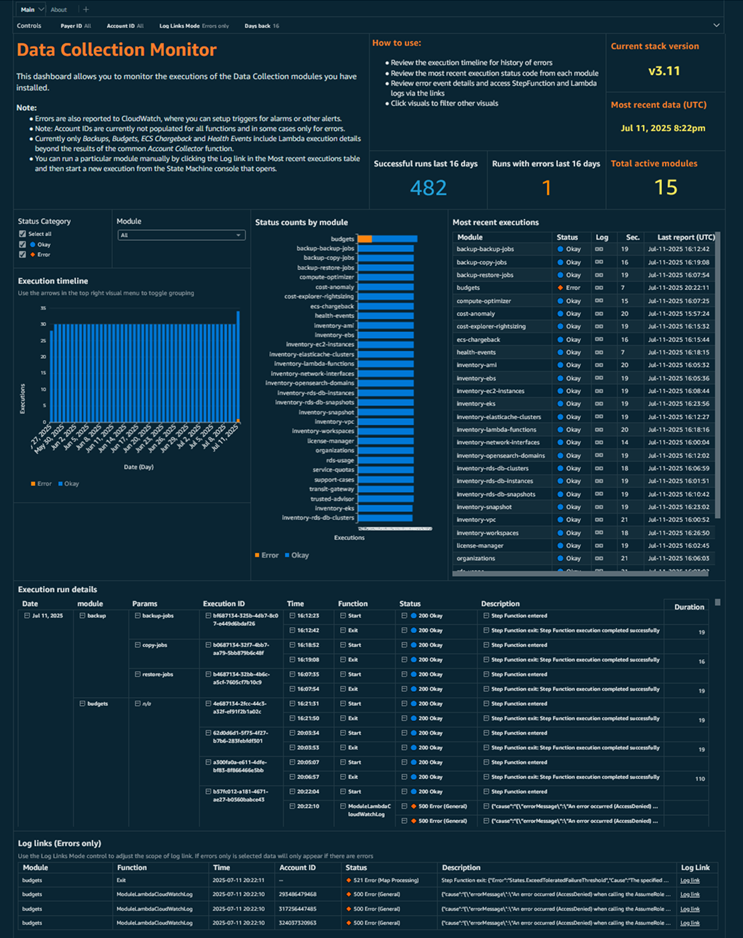
Data Collection Monitor Dashboard provides instrumentation log data to help you monitor the executions of the various modules of the Data Collection Framework. Starting with version 3.11, most Data Collection modules emit basic log data to track module execution and potential errors encountered. This dashboard reads that instrumentation data to present multiple views to track historical executions as well as troubleshoot any issues. |
|
IT Administrators, FinOps |


Additional
Other dashboards that require different additional Data Sources or niche use cases from AWS Cost And Usage Report data.
|
Dashboard |
Preview |
Links |
Target Audience |
|
CORA Dashboard (Cost Optimization Recommended Actions Dashboard) is based on the data from AWS Cost Optimization Hub providing Rightsizing, Migration to Graviton, Idle resources, Savings Plan and Reserved instances recommendations. This dashboard can help you tracing your Cost Optimization Opportunities over time and group recommendations by owners of workloads. |
|
Executives, Finance/Procurement, FinOps, Product Owners |
|
|
Cloud Intelligence Dashboard for Azure |
|
Executives, Finance/Procurement, FinOps, Product Owners |
|
|
Cloud Intelligence Dashboard for GCP |
|
Executives, Finance/Procurement, FinOps, Product Owners |
|
|
FOCUS Dashboard (Preview) is an open source and customizable dashboard which provides pre-defined visuals to get actionable insights from FOCUS data in Amazon QuickSight. It allows you to quickly get started with using FOCUS specification in your organization |
|
Executives, Finance/Procurement, FinOps, Product Owners |
|
|
AWS Marketplace Single Pane of Glass (SPG) Dashboard is the one-stop dashboard for AWS Marketplace buyers in procurement, FinOps, and legal, to visualize AWS Marketplace spend and usage. It enables AWS Marketplace buyers to get insights into Marketplace subscriptions without navigating to multiple AWS consoles, requiring specific IAM privileges, or having deep technical proficiency on AWS services. It covers all Marketplace subscriptions including self-service public offers, private offers and all types of Marketplace offerings (software, data and services). |
|
AWS Marketplace Buyers, Procurement, Sourcing, Finance, FinOps, Legal, GRC, IT, BizApps |
|
|
Kubecost Containers Cost Allocation Dashboard is a solution that enables DevOps teams, FinOps teams and any stakeholder, to get insights into Kubernetes in-cluster cost and usage based on data collected from Kubecost. It provides teams with the ability to allocate cost to Kubernetes workloads, and apply showback and chargeback for multi-tenant Kubernetes clusters. It also allows teams to understand the clusters efficiency, in the goal of right-sizing containers requests. |
|
DevOps, FinOps, Cloud Engineering, Product Management |
|
|
SCAD Containers Cost Allocation Dashboard is a solution that enables DevOps teams, FinOps teams and any stakeholder, to get insights into EKS and ECS in-cluster cost based on data from CUR’s Split Cost Allocation Data (SCAD) feature. It provides teams with the ability to allocate cost to EKS and ECS workloads, and apply showback and chargeback for multi-tenant EKS and ECS clusters. |
|
DevOps, FinOps, Cloud Engineering, Product Management |
|
|
Sustainability Proxy Metrics Dashboard |
|
Product owners, FinOps, DevOps, Engineering teams |
|
|
Trends Dashboard provides Financial and Technology organizational leaders access to proactive trends, signals, insights and anomalies to understand and analyze their AWS cloud usage |
|
Executives, Finance/Procurement |
|
|
Data Transfer Dashboard helps customers gain insights into their data transfer. It will analyze any data transfer that incurs a cost such as Outbound/Internet, Inter Region and Inter AZ data transfer from all services. |
|
Network Team |
|
|
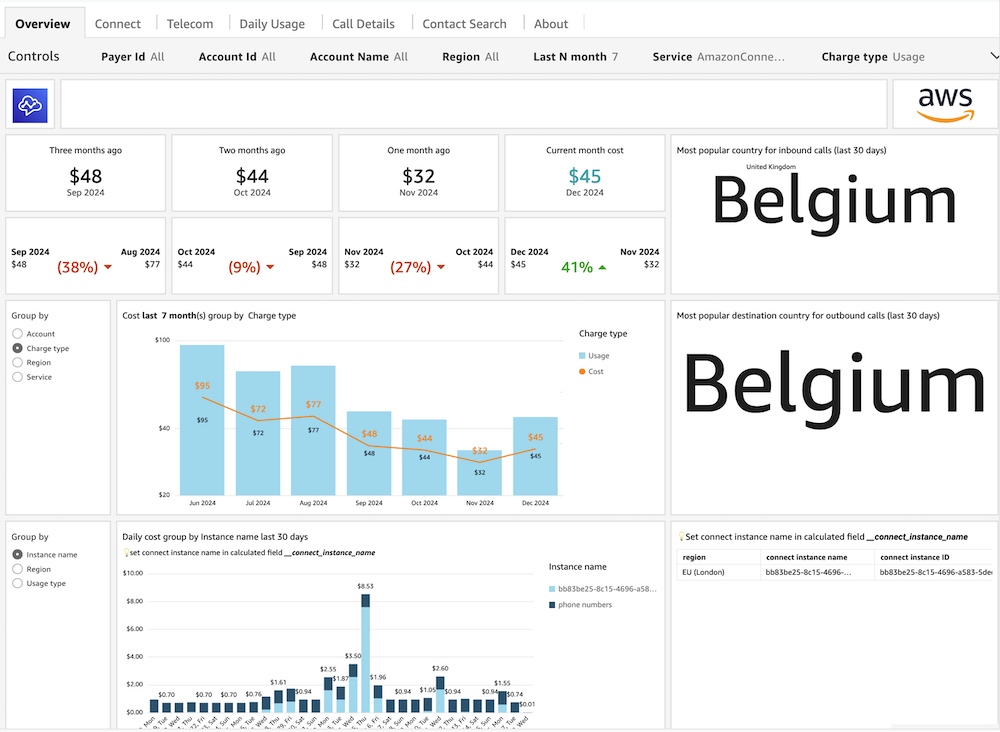
Amazon
Connect Cost Insights Dashboard provides an overview of
Amazon Connect service |
|
FinOps, Telecom Engineering, Product Management |
|
|
Config Resource Compliance Dashboard shows the inventory of your AWS resources, along with their compliance status, across multiple AWS accounts and regions by leveraging your AWS Config data |
|
Security teams, SecOps, DevOps, Product Owners, Engineering teams |