Instrumenting Go code in AWS Lambda
Lambda integrates with AWS X-Ray to help you trace, debug, and optimize Lambda applications. You can use X-Ray to trace a request as it traverses resources in your application, which may include Lambda functions and other AWS services.
To send tracing data to X-Ray, you can use one of two SDK libraries:
-
AWS Distro for OpenTelemetry (ADOT)
– A secure, production-ready, AWS-supported distribution of the OpenTelemetry (OTel) SDK. -
AWS X-Ray SDK for Go – An SDK for generating and sending trace data to X-Ray.
Each of the SDKs offer ways to send your telemetry data to the X-Ray service. You can then use X-Ray to view, filter, and gain insights into your application's performance metrics to identify issues and opportunities for optimization.
Important
The X-Ray and Powertools for AWS Lambda SDKs are part of a tightly integrated instrumentation solution offered by AWS. The ADOT Lambda Layers are part of an industry-wide standard for tracing instrumentation that collect more data in general, but may not be suited for all use cases. You can implement end-to-end tracing in X-Ray using either solution. To learn more about choosing between them, see Choosing between the AWS Distro for Open Telemetry and X-Ray SDKs.
Sections
Using ADOT to instrument your Go functions
ADOT provides fully managed Lambda layers that package
everything you need to collect telemetry data using the OTel SDK. By consuming this layer, you can instrument your
Lambda functions without having to modify any function code. You can also configure your layer to do custom
initialization of OTel. For more information, see Custom configuration for the ADOT Collector on Lambda
For Go runtimes, you can add the AWS managed Lambda layer for ADOT Go
to automatically instrument your functions. For detailed instructions on how to add this layer, see AWS Distro for OpenTelemetry Lambda
Support for Go
Using the X-Ray SDK to instrument your Go functions
To record details about calls that your Lambda function makes to other resources in your application,
you can also use the AWS X-Ray SDK for Go. To get the SDK, download the SDK from its GitHub repositorygo get:
go get github.com/aws/aws-xray-sdk-go
To instrument AWS SDK clients, pass the client to the xray.AWS() method. You can then
trace calls by using the WithContext version of the method.
svc := s3.New(session.New())
xray.AWS(svc.Client)
...
svc.ListBucketsWithContext(ctx aws.Context, input *ListBucketsInput)
After you add the correct dependencies and make the necessary code changes, activate tracing in your function's configuration via the Lambda console or the API.
Activating tracing with the Lambda console
To toggle active tracing on your Lambda function with the console, follow these steps:
To turn on active tracing
Open the Functions page
of the Lambda console. -
Choose a function.
Choose Configuration and then choose Monitoring and operations tools.
Under Additional monitoring tools, choose Edit.
-
Under CloudWatch Application Signals and AWS X-Ray, choose Enable for Lambda service traces.
-
Choose Save.
Activating tracing with the Lambda API
Configure tracing on your Lambda function with the AWS CLI or AWS SDK, use the following API operations:
The following example AWS CLI command enables active tracing on a function named my-function.
aws lambda update-function-configuration --function-name my-function \
--tracing-config Mode=Active
Tracing mode is part of the version-specific configuration when you publish a version of your function. You can't change the tracing mode on a published version.
Activating tracing with CloudFormation
To activate tracing on an AWS::Lambda::Function resource in an CloudFormation template, use the
TracingConfig property.
Example function-inline.yml
Resources: function: Type: AWS::Lambda::Function Properties:TracingConfig: Mode: Active...
For an AWS Serverless Application Model (AWS SAM) AWS::Serverless::Function resource, use the Tracing
property.
Example template.yml
Resources: function: Type: AWS::Serverless::Function Properties:Tracing: Active...
Interpreting an X-Ray trace
Your function needs permission to upload trace data to X-Ray. When you activate tracing in the Lambda
console, Lambda adds the required permissions to your function's execution role. Otherwise, add the AWSXRayDaemonWriteAccess
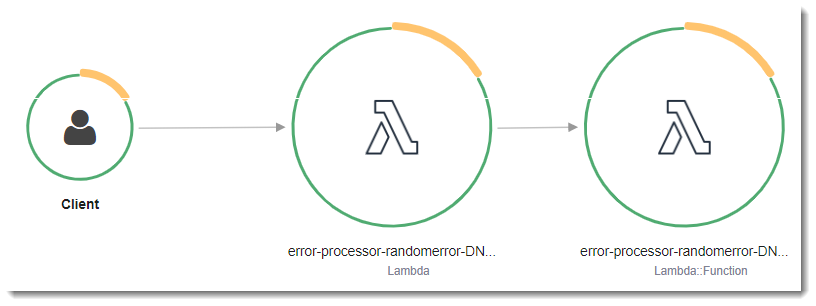
After you've configured active tracing, you can observe specific requests through your application. The X-Ray service graph shows information about your application and all its components. The following example shows an application with two functions. The primary function processes events and sometimes returns errors. The second function at the top processes errors that appear in the first's log group and uses the AWS SDK to call X-Ray, Amazon Simple Storage Service (Amazon S3), and Amazon CloudWatch Logs.

X-Ray doesn't trace all requests to your application. X-Ray applies a sampling algorithm to ensure that tracing is efficient, while still providing a representative sample of all requests. The sampling rate is 1 request per second and 5 percent of additional requests. You can't configure the X-Ray sampling rate for your functions.
In X-Ray, a trace records information about a request that is processed by one or more services. Lambda records 2 segments per trace, which creates two nodes on the service graph. The following image highlights these two nodes:
The first node on the left represents the Lambda service, which receives the invocation request. The second
node represents your specific Lambda function. The following example shows a trace with these two segments. Both
are named my-function, but one has an origin of AWS::Lambda and the other has
an origin of AWS::Lambda::Function. If the AWS::Lambda segment shows an error, the Lambda service had an issue. If the AWS::Lambda::Function segment shows an error, your function had an issue.

This example expands the AWS::Lambda::Function segment to show its three subsegments.
Note
AWS is currently implementing changes to the Lambda service. Due to these changes, you may see minor differences between the structure and content of system log messages and trace segments emitted by different Lambda functions in your AWS account.
The example trace shown here illustrates the old-style function segment. The differences between the old- and new-style segments are described in the following paragraphs.
These changes will be implemented during the coming weeks, and all functions in all AWS Regions except the China and GovCloud regions will transition to use the new-format log messages and trace segments.
The old-style function segment contains the following subsegments:
-
Initialization – Represents time spent loading your function and running initialization code. This subsegment only appears for the first event that each instance of your function processes.
-
Invocation – Represents the time spent running your handler code.
-
Overhead – Represents the time the Lambda runtime spends preparing to handle the next event.
The new-style function segment doesn't contain an Invocation subsegment. Instead,
customer subsegments are attached directly to the function segment. For more information about the structure of the
old- and new-style function segments, see Understanding X-Ray traces.
You can also instrument HTTP clients, record SQL queries, and create custom subsegments with annotations and metadata. For more information, see the AWS X-Ray SDK for Go in the AWS X-Ray Developer Guide.
Pricing
You can use X-Ray tracing for free each month up to a certain limit as part of the AWS Free Tier. Beyond that threshold, X-Ray charges for trace storage and
retrieval. For more information, see AWS X-Ray pricing
