Amazon CloudWatch alarms for cluster metrics
Starting with AWS ParallelCluster version 3.6, you can configure your cluster with Amazon CloudWatch alarms for monitoring
the head node. One alarm monitors the root volume disk_used_percent. The other alarm monitors the
mem_used_percent metric. For more information,
see Metrics collected by the CloudWatch agent
in the Amazon CloudWatch User Guide.
The alarms are named as follows:
-
cluster-name_DiskAlarm_HeadNode -
cluster-name_MemAlarm_HeadNode
cluster-name is the name of your cluster.
Access the alarms in the CloudWatch console by choosing Alarms in the navigation pane. The following images show the disk usage alarm and memory usage alarm for a cluster.
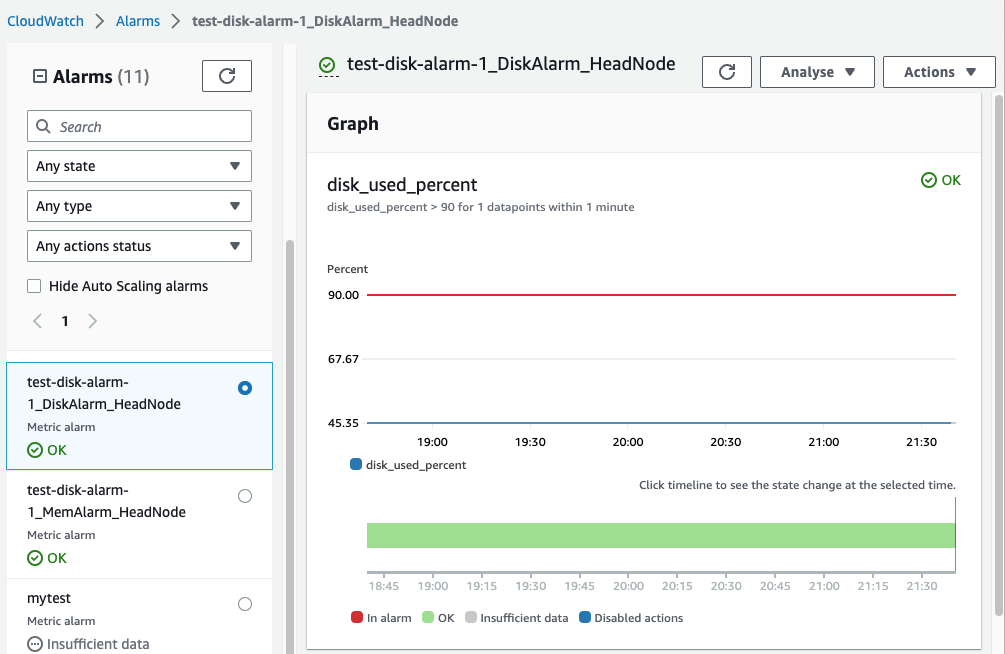

The disk usage alarm is in the ALARM state when the disk usage percentage is greater than 90% for 1 data point, within a 1 minute
time period.
The memory usage alarm is in the ALARM state when the memory usage percentage is greater than 90% for 1 data point, within a 1
minute time period.
Note
AWS ParallelCluster doesn't configure alarm actions by default. For information about how to set up alarm actions, such as sending notifications, see Alarm actions. For more information about Amazon CloudWatch alarms, see Using Amazon CloudWatch alarms in the Amazon CloudWatch User Guide.
If you don’t want to create these Amazon CloudWatch alarms, deactivate them by setting Monitoring /
Dashboards / CloudWatch / Enabled to false in the
cluster configuration. This also disables the creation of the Amazon CloudWatch dashboard. For more information, see Amazon CloudWatch dashboard.
Note
If you deactivate the creation of the Amazon CloudWatch dashboard, you also deactivate the Amazon CloudWatch disk_used_percent and
memory_used_percent alarms for your cluster.
