Amazon CloudWatch dashboard
An Amazon CloudWatch dashboard is created when a cluster is created.
This makes it easier to monitor the nodes in your cluster, and to view the logs stored in Amazon CloudWatch Logs. The name of the
dashboard is ClusterName-RegionClusterName is the name of your cluster and Region is the
AWS Region the cluster is in. You can access the dashboard in the console, or by opening
https://console.aws.amazon.com/cloudwatch/home?region=.Region#dashboards:name=ClusterName-Region
The following image shows an example CloudWatch dashboard for a cluster.
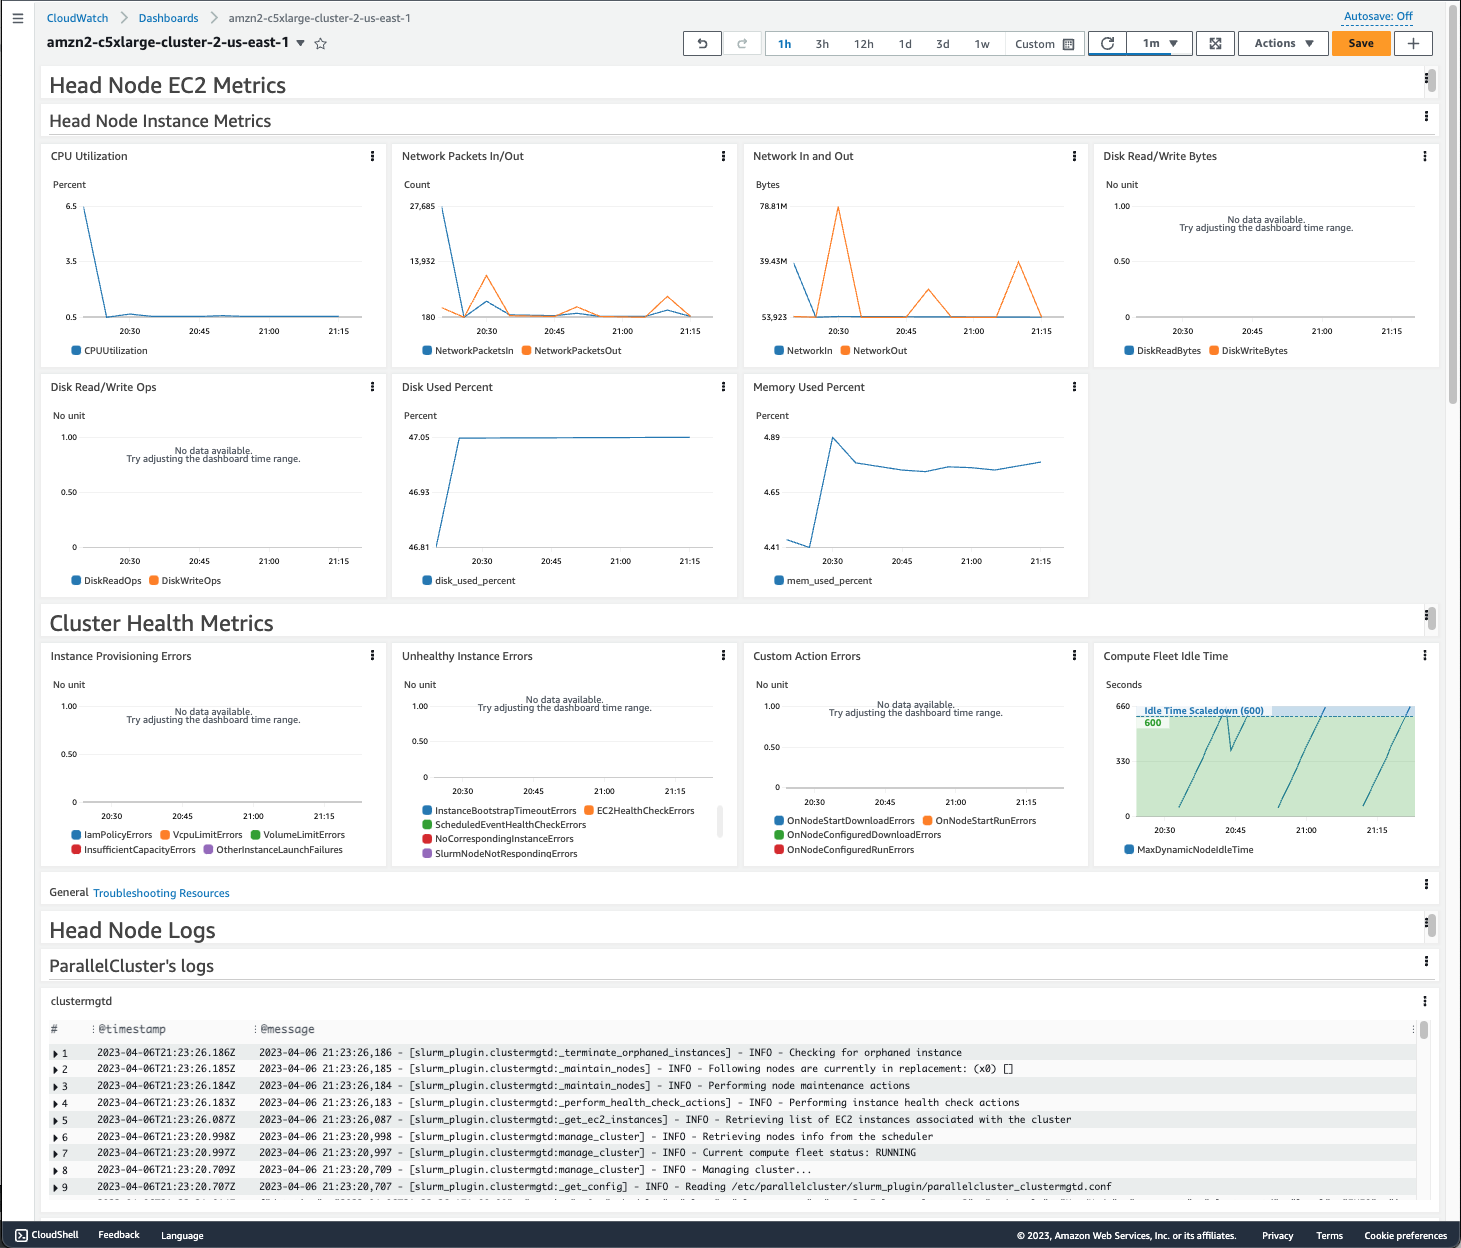
Head Node Instance Metrics
The first section of the dashboard displays graphs of the head node Amazon EC2 metrics.
If your cluster has shared storage, the next section shows shared storage metrics.
Cluster Health Metrics
If your cluster uses Slurm for scheduling, the cluster health metric graphs show real-time cluster compute node errors. For more information, see Troubleshooting cluster health metrics. Cluster health metrics are added to the dashboard starting with AWS ParallelCluster version 3.6.0.
Head Node Logs
The final section lists head node logs grouped by AWS ParallelCluster's logs, Scheduler's logs, Amazon DCV integration logs, and System's logs.
For more information about Amazon CloudWatch dashboards, see Using Amazon CloudWatch dashboards in the Amazon CloudWatch User Guide.
If you don’t want to create the Amazon CloudWatch dashboard, you can turn it off by setting Monitoring
/ Dashboards / CloudWatch / Enabled to false.
Note
If you disable the creation of the Amazon CloudWatch dashboard, you also disable the Amazon CloudWatch disk_used_percent and
memory_used_percent alarms for your cluster. For more information, see Amazon CloudWatch alarms for cluster metrics.
The disk_used_percent and memory_used_percent alarms are added starting with AWS ParallelCluster version 3.6.
