Estimate the cost of a DynamoDB table for on-demand capacity
Moinul Al-Mamun, Amazon Web Services
Summary
Amazon DynamoDB
With on-demand capacity mode, you pay per request for the data reads and writes that your application performs on the tables. AWS charges are based on the accumulated read request units (RRUs) and write request units (WRUs) in a month. DynamoDB monitors the size of your table continuously throughout the month to determine your storage charges. It supports continuous backup with point-in-time-recovery (PITR). DynamoDB monitors the size of your PITR-enabled tables continuously throughout the month to determine your backup charges.
To estimate the DynamoDB cost for a project, it’s important to calculate how much RRU, WRU, and storage will be consumed at different stages of your product lifecycle. For a rough cost estimation, you can use AWS Pricing Calculator
This pattern provides a mechanism and a re-usable Microsoft Excel template to estimate basic DynamoDB cost factors, such as write, read, storage, backup and recovery cost, for on-demand capacity mode. It is more granular than AWS Pricing Calculator, and it considers base table and GSIs requirements independently. It also considers the monthly item data growth rate and forecasts costs for three years.
Prerequisites and limitations
Prerequisites
Basic knowledge of DynamoDB and DynamoDB data model design
Basic knowledge of DynamoDB pricing, WRU, RRU, storage, and backup and recovery (for more information, see Pricing for On-Demand Capacity
) Knowledge of your data, data model, and item size in DynamoDB
Knowledge of DynamoDB GSIs
Limitations
The template provides you with an approximate calculation, but it isn’t appropriate for all configurations. To get a more accurate estimate, you must measure the individual item size for each item in the base table and GSIs.
For a more accurate estimate, you must consider the expected number of writes (insert, update, and delete) and reads for each item in an average month.
This pattern supports estimating only write, read, storage, and backup and recovery costs for next few years based on fixed data growth assumptions.
Tools
AWS services
Amazon DynamoDB is a fully managed NoSQL database service that provides fast, predictable, and scalable performance.
Other tools
AWS Pricing Calculator
is a web-based planning tool that you can use to create estimates for your AWS use cases.
Best practices
To help keep costs low, consider the following DynamoDB design best practices.
Partition key design – Use a high-cardinality partition key to distribute load evenly.
Adjacency list design pattern – Use this design pattern for managing one-to-many and many-to-many relationships.
Sparse index – Use sparse index for your GSIs. When you create a GSI, you specify a partition key and optionally a sort key. Only items in the base table that contain a corresponding GSI partition key appear in the sparse index. This helps to keep GSIs smaller.
Index overloading – Use the same GSI for indexing various types of items.
GSI write sharding – Shard wisely to distribute data across the partitions for efficient and faster queries.
Large items – Store only metadata inside the table, save the blob in Amazon S3, and keep the reference in DynamoDB. Break large items into multiple items, and efficiently index by using sort keys.
For more design best practices, see the Amazon DynamoDB Developer Guide.
Epics
| Task | Description | Skills required |
|---|---|---|
Get item size. |
| Data engineer |
Estimate the write cost. | To estimate write cost in on-demand capacity mode, first you have to measure how many WRUs will be consumed in a month. For that, you need to consider the following factors:
For more information, see the Additional information section. | Data engineer |
Estimate the read cost. | To estimate read cost in on-demand mode, first you have to measure how many RRUs will be consumed in a month. For that, you need to consider the following factors:
| Data engineer, App developer |
Estimate the storage size and cost. | First, estimate the average monthly storage requirement based on your item size in the table. Then calculate storage cost by multiplying storage size by the per GB storage price for your AWS Region. If you already entered data for estimating the write cost, you don't need to enter it again for calculating storage size. Otherwise, to estimate storage size, you need to consider the following factors:
| Data engineer |
| Task | Description | Skills required |
|---|---|---|
Download the Excel template from the Attachments section, and adjust it for your use case table. |
| Data engineer |
Enter information in the Excel template. |
In the template, there are three items, or entities: information, metadata, and relationship. There are two GSIs. For your use case, if you need more items, create new rows. If you need more GSIs, copy an existing GSI block, and paste to create as many GSI blocks as you need. Then adjust the SUM and TOTAL column calculations. | Data engineer |
Related resources
References
Guides and patterns
Additional information
Write cost calculation example
The DynamoDB data model design shows three items for a product, and an average item size of 4 KB. When you add a new product into the DynamoDB base table, it consumes the number of items * (item size/1 KB write unit) = 3 * (4/1) = 12 WRU. In this example, for writing 1 KB, the product consumes 1 WRU.
Read cost calculation example
To get the RRU estimation, consider the average of how many times each item will be read in a month. For example, the Information item will be read, on average, 10 times in a month, and the metadata item will be read two times, and the relationship item will be read five times. In the example template, total RRU for all components = number of new components created each month * RRU per component per month = 10 million * 17 RRU = 170 million RRU each month.
Every month, new things (components or products will be added, and the total number of products will grow over time. So, RRU requirements will also grow over time.
For the first month RRU, consumption will be 170 million.
For the second month, RRU consumption will be 2 * 170 million = 340 million.
For the third month RRU consumption will be 3 * 170 million = 510 million.
The following graph shows monthly RRU consumption and cost forecasting.
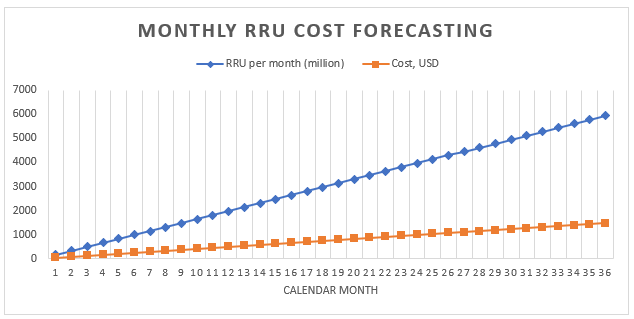
Note that prices within the graph are for illustration only. To create accurate forecasts for your use case, check the AWS pricing page, and use those prices in the Excel sheet.
Storage, backup, and recovery cost calculation examples
DynamoDB storage, backup and restore all are connected with each other. Backup is directly connected with storage, and recovery is directly connected with backup size. As the table size increases, corresponding storage, backup, and restore costs will increase proportionally.
Storage size and cost
Storage cost will increase over time based on your data growth rate. For example, assume that the average size of a component or product in the base table and GSIs is 11 KB, and 10 million new products will be added every month into your database table. In that case, your DynamoDB table size will grow (11 KB * 10 million)/1024/1024 = 105 GB per month. At the first month, your table storage size will be 105 GB, at second month it will be 105 + 105 = 210 GBs, and so on.
For the first month, storage cost will be 105 GB * storage price per GB for your AWS Region.
For the second month, storage cost will be 210 GB * storage price per GB for your Region.
For the third month, storage cost will be 315 GB * storage price per GB for your Region.
For storage size and cost for next three years, see the Storage size and forecasting section.
Backup cost
Backup cost will increase over time based on your data growth rate. When you turn on continuous backup with point-in-time-recovery (PITR), continuous backup charges are based on average storage GB-Month. In a calendar month, the average backup size would be the same as your table storage size, although the actual size could be a bit different. As new products will be added every month, the total storage size and the backup size will grow over time. For example, for the first month, the average backup size of 105 GB could grow to 210 GB for the second month.
For the first month, backup cost will be 105 GB-month * continuous backup price per GB for your AWS Region.
For the second month, backup cost will be 210 GB-month * continuous backup price per GB for your Region.
For the third month, backup cost will be 315 GB-month * continuous backup price per GB for your Region.
and, so on
Backup cost is included in the graph in the Storage size and cost forecasting section.
Recovery cost
When you are taking continuous backup with PITR enabled, recovery operation charges are based on the size of the restore. Each time that you restore, you pay based on gigabytes of restored data. If your table size is large and you perform restore multiple times in a month, it will be costly.
To estimate restore cost, this example assumes that you perform a PITR recovery one time each month at the end of the month. The example uses the monthly average backup size as the restore data size for that month. For the first month, the average backup size is 105 GB, and for the recovery at end of the month, the restore data size would be 105 GB. For the second month, it would be 210 GBs, and so on.
Recovery cost will increase over time based on your data growth rate.
For the first month, recovery cost will be 105 GB * restore price per GB for your AWS Region.
For the second month, recovery cost will be 210 GB * restore price per GB for your Region.
For the third month, recovery cost will be 315 GB * restore price per GB for your Region.
For more information, see the Storage, backup and recovery tab in the Excel template and the graph in the following section.
Storage size and cost forecasting
In the template, actual billable storage size is calculated by subtracting the free tier 25 GB per month for the Standard table class. In the sheet, you will get a forecasting graph broken out into monthly values.
The following example chart forecasts monthly storage size in GB, billable storage cost, on-demand backup cost, and recovery cost for next 36 calendar months. All costs are in USD. From the graph, it’s clear that storage, backup, and recovery costs increase proportionally to increases in storage size.

Note that prices used in the graph are for illustration purposes only. To create accurate prices for your use case, check the AWS pricing page, and use those prices in the Excel template.
Attachments
To access additional content that is associated with this document, unzip the following file: attachment.zip
