Formatting in Amazon QuickSight
You choose from a variety of options to format and style your data visualizations. To format a visual, select the visual that you want to format and choose the Format visual icon on the upper-right corner of the visual. Once you have the format visual pane open, you can click on different visuals and controls to view formatting data for the specific visual or control. For more information about formatting a visual control, see Using a control with a parameter in Amazon QuickSight.
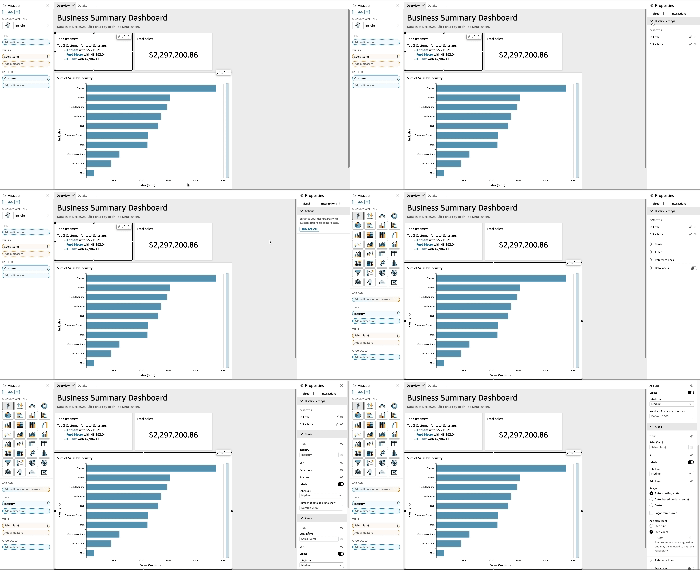
Use the following sections to format and style your content:
Note
Any format changes applied from the field wells are applied only to the selected visual.
Topics
- Analytics formatting per type in QuickSight
- Table and pivot table formatting options in QuickSight
- Adding data bars to tables in QuickSight
- Map and geospatial chart formatting options in QuickSight
- Axes and grid lines on visual types in QuickSight
- Colors in visual types in QuickSight
- Working with field level coloring in Amazon QuickSight
- Conditional formatting on visual types in QuickSight
- Font and style on visual types in QuickSight
- KPI options
- Labels on visual types in QuickSight
- Formatting visual numeric data based on language settings in QuickSight
- Legends on visual types in QuickSight
- Line and marker styling on line charts in QuickSight
- Missing data on visual types in QuickSight
- Reference lines on visuals types in QuickSight
- Formatting radar charts in QuickSight
- Range and scale on visual types in QuickSight
- Small multiples axis options
- Titles and subtitles on visual types in QuickSight in QuickSight
- Tooltips on visual types in QuickSight