Amazon SageMaker Debugger
Note
After careful consideration, we have made the decision to close new customer access to Amazon Sagemaker Debugger, effective 7/30/26. Existing customers can continue to use the service as normal. AWS continues to invest in security and availability improvements for Debugger, but we do not plan to introduce new features. For more information, see Debugger availability change.
Debug model output tensors from machine learning training jobs in real time and detect non-converging issues using Amazon SageMaker Debugger.
Amazon SageMaker Debugger features
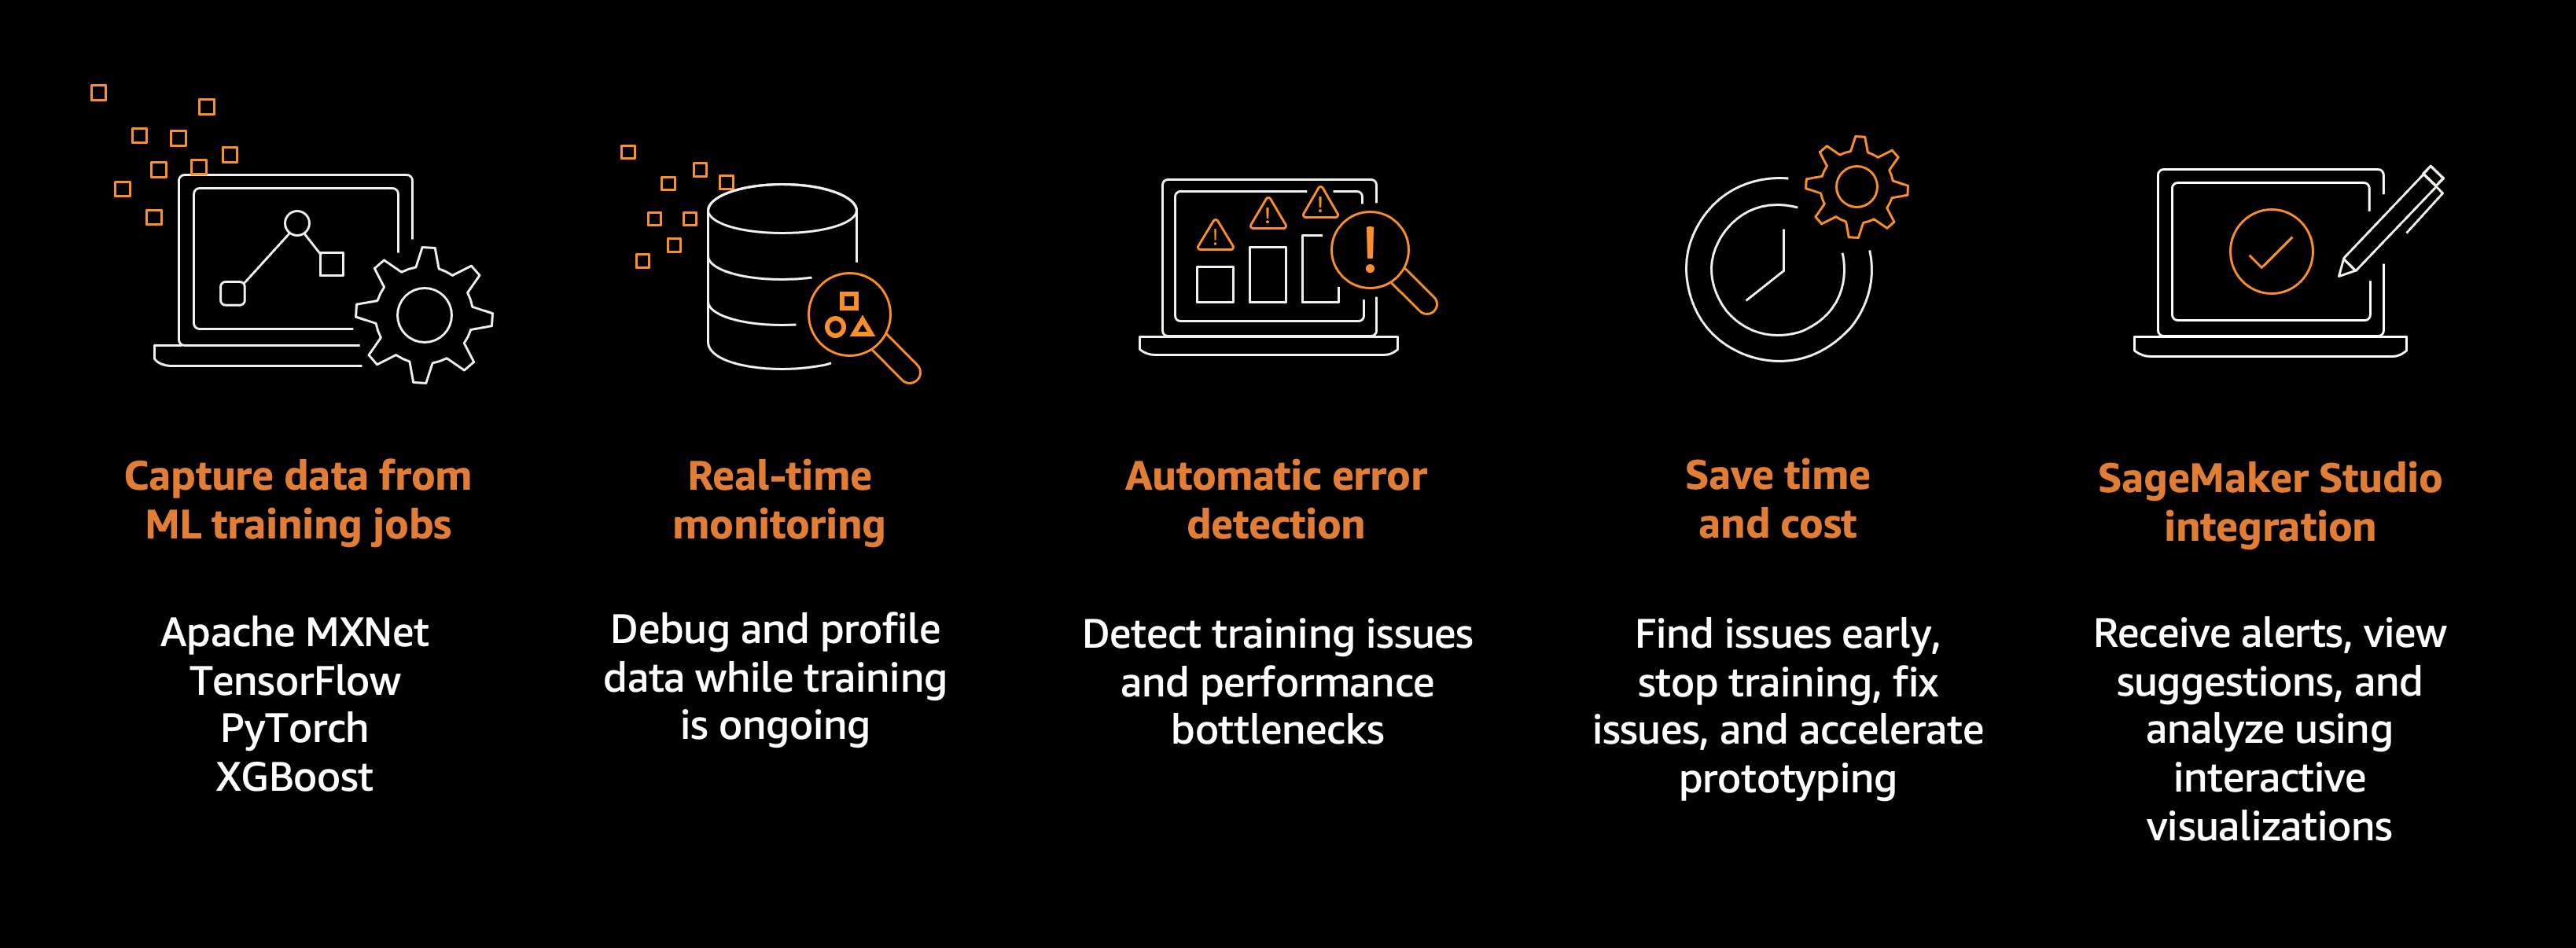
A machine learning (ML) training job can have problems such as overfitting, saturated activation functions, and vanishing gradients, which can compromise model performance.
SageMaker Debugger provides tools to debug training jobs and resolve such problems to improve the performance of your model. Debugger also offers tools to send alerts when training anomalies are found, take actions against the problems, and identify the root cause of them by visualizing collected metrics and tensors.
SageMaker Debugger supports the Apache MXNet, PyTorch, TensorFlow, and XGBoost frameworks. For more information about available frameworks and versions supported by SageMaker Debugger, see Supported frameworks and algorithms.
The high-level Debugger workflow is as follows:
-
Modify your training script with the
sagemaker-debuggerPython SDK if needed. -
Configure a SageMaker training job with SageMaker Debugger.
-
Configure using the SageMaker AI ModelTrainer API (for Python SDK).
-
Configure using the SageMaker AI
CreateTrainingJobrequest (for Boto3 or CLI). -
Configure custom training containers with SageMaker Debugger.
-
-
Start a training job and monitor training issues in real time.
-
Get alerts and take prompt actions against the training issues.
-
Receive texts and emails and stop training jobs when training issues are found using Use Debugger built-in actions for rules.
-
Set up your own actions using Amazon CloudWatch Events and AWS Lambda.
-
-
Explore deep analysis of the training issues.
-
For debugging model output tensors, see Visualize Debugger Output Tensors in TensorBoard.
-
-
Fix the issues, consider the suggestions provided by Debugger, and repeat steps 1–5 until you optimize your model and achieve target accuracy.
The SageMaker Debugger developer guide walks you through the following topics.
Topics
