Logging IP traffic using VPC Flow Logs
VPC Flow Logs is a feature that enables you to capture information about the IP traffic going to and from network interfaces in your VPC. Flow log data can be published to the following locations: Amazon CloudWatch Logs, Amazon S3, or Amazon Data Firehose. After you create a flow log, you can retrieve and view the flow log records in the log group, bucket, or delivery stream that you configured.
Flow logs can help you with a number of tasks, such as:
-
Diagnosing overly restrictive security group rules
-
Monitoring the traffic that is reaching your instance
-
Determining the direction of the traffic to and from the network interfaces
Flow log data is collected outside of the path of your network traffic, and therefore does not affect network throughput or latency. You can create or delete flow logs without any risk of impact to network performance.
Note
This section only talks about flow logs for VPCs. For information about flow logs for transit gateways introduced in version 6, see Logging network traffic using Transit Gateway Flow Logs in the Amazon VPC Transit Gateways User Guide.
Contents
Flow logs basics
You can create a flow log for a VPC, a subnet, or a network interface. If you create a flow log for a subnet or VPC, each network interface in that subnet or VPC is monitored.
Flow log data for a monitored network interface is recorded as flow log records, which are log events consisting of fields that describe the traffic flow. For more information, see Flow log records.
To create a flow log, you specify:
-
The resource for which to create the flow log
-
The type of traffic to capture (accepted traffic, rejected traffic, or all traffic)
-
The destinations to which you want to publish the flow log data
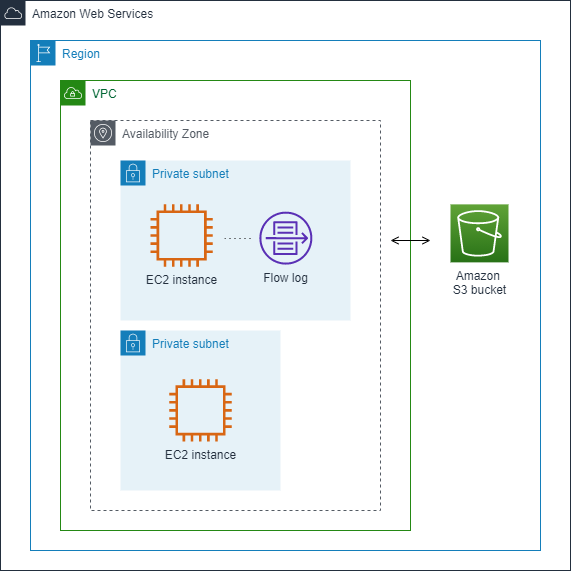
In the following example, you create a flow log that captures accepted traffic for the network interface for one of the EC2 instances in a private subnet and publishes the flow log records to an Amazon S3 bucket.
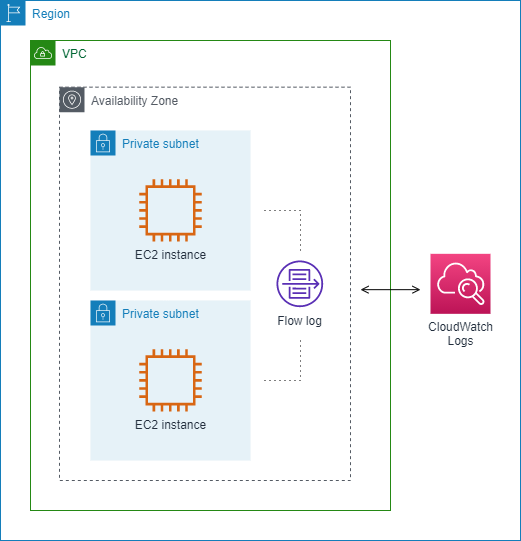
In the following example, a flow log captures all traffic for a subnet and publishes the flow log records to Amazon CloudWatch Logs. The flow log captures traffic for all network interfaces in the subnet.
After you create a flow log, it can take several minutes to begin collecting and publishing data to the chosen destinations. Flow logs do not capture real-time log streams for your network interfaces. For more information, see Create a flow log.
If you launch an instance into your subnet after you create a flow log for your subnet or VPC, we create a log stream (for CloudWatch Logs) or log file object (for Amazon S3) for the new network interface as soon as there is network traffic for the network interface.
You can create flow logs for network interfaces that are created by other AWS services, such as:
-
Elastic Load Balancing
-
Amazon RDS
-
Amazon ElastiCache
-
Amazon Redshift
-
Amazon WorkSpaces
-
NAT gateways
-
Transit gateways
Regardless of the type of network interface, you must use the Amazon EC2 console or the Amazon EC2 API to create a flow log for a network interface.
You can apply tags to your flow logs. Each tag consists of a key and an optional value, both of which you define. Tags can help you organize your flow logs, for example by purpose or owner.
If you no longer require a flow log, you can delete it. Deleting a flow log disables the flow log service for the resource, so that no new flow log records are created or published. Deleting a flow log does not delete any existing flow log data. After you delete a flow log, you can delete the flow log data directly from the destination when you are finished with it. For more information, see Delete a flow log.
Flow log records
A flow log record represents a network flow in your VPC. By default, each record captures a network internet protocol (IP) traffic flow (characterized by a 5-tuple on a per network interface basis) that occurs within an aggregation interval, also referred to as a capture window.
Each record is a string with fields separated by spaces. A record includes values for the different components of the IP flow, for example, the source, destination, and protocol.
When you create a flow log, you can use the default format for the flow log record, or you can specify a custom format.
Aggregation interval
The aggregation interval is the period of time during which a particular flow is captured and aggregated into a flow log record. By default, the maximum aggregation interval is 10 minutes. When you create a flow log, you can optionally specify a maximum aggregation interval of 1 minute. Flow logs with a maximum aggregation interval of 1 minute produce a higher volume of flow log records than flow logs with a maximum aggregation interval of 10 minutes.
When a network interface is attached to a Nitro-based instance, the aggregation interval is always 1 minute or less, regardless of the specified maximum aggregation interval.
After data is captured within an aggregation interval, it takes additional time to process and publish the data to CloudWatch Logs or Amazon S3. The flow log service typically delivers logs to CloudWatch Logs in about 5 minutes and to Amazon S3 in about 10 minutes. However, log delivery is on a best effort basis, and your logs might be delayed beyond the typical delivery time.
Default format
With the default format, the flow log records include the version 2 fields, in the order shown in the available fields table. You cannot customize or change the default format. To capture additional fields or a different subset of fields, specify a custom format instead.
Custom format
With a custom format, you specify which fields are included in the flow log records and in which order. This enables you to create flow logs that are specific to your needs and to omit fields that are not relevant. Using a custom format can reduce the need for separate processes to extract specific information from the published flow logs. You can specify any number of the available flow log fields, but you must specify at least one.
Available fields
The following table describes all of the available fields for a flow log record. The Version column indicates the VPC Flow Logs version in which the field was introduced. The default format includes all version 2 fields, in the same order that they appear in the table.
When publishing flow log data to Amazon S3, the data type for the fields depends on the flow log format. If the format is plain text, all fields are of type STRING. If the format is Parquet, see the table for the field data types.
If a field is not applicable or could not be computed for a specific record, the record displays a '-' symbol for that entry. Metadata fields that do not come directly from the packet header are best effort approximations, and their values might be missing or inaccurate.
| Field | Description | Version |
|---|---|---|
|
version |
The VPC Flow Logs version. If you use the default format, the version is 2. If you use a custom format, the version is the highest version among the specified fields. For example, if you specify only fields from version 2, the version is 2. If you specify a mixture of fields from versions 2, 3, and 4, the version is 4. Parquet data type: INT_32 |
2 |
|
account-id |
The AWS account ID of the owner of the source network interface for which traffic is recorded. If the network interface is created by an AWS service, for example when creating a VPC endpoint or Network Load Balancer, the record might display unknown for this field. Parquet data type: STRING |
2 |
|
interface-id |
The ID of the network interface for which the traffic is recorded. Parquet data type: STRING |
2 |
|
srcaddr |
The source address for incoming traffic, or the IPv4 or IPv6 address of the network interface for outgoing traffic on the network interface. The IPv4 address of the network interface is always its private IPv4 address. See also pkt-srcaddr. Parquet data type: STRING |
2 |
|
dstaddr |
The destination address for outgoing traffic, or the IPv4 or IPv6 address of the network interface for incoming traffic on the network interface. The IPv4 address of the network interface is always its private IPv4 address. See also pkt-dstaddr. Parquet data type: STRING |
2 |
|
srcport |
The source port of the traffic. Parquet data type: INT_32 |
2 |
|
dstport |
The destination port of the traffic. Parquet data type: INT_32 |
2 |
|
protocol |
The IANA protocol number of the traffic. For more information,
see Assigned Internet Protocol Numbers Parquet data type: INT_32 |
2 |
|
packets |
The number of packets transferred during the flow. Parquet data type: INT_64 |
2 |
|
bytes |
The number of bytes transferred during the flow. Parquet data type: INT_64 |
2 |
|
start |
The time, in Unix seconds, when the first packet of the flow was received within the aggregation interval. This might be up to 60 seconds after the packet was transmitted or received on the network interface. Parquet data type: INT_64 |
2 |
|
end |
The time, in Unix seconds, when the last packet of the flow was received within the aggregation interval. This might be up to 60 seconds after the packet was transmitted or received on the network interface. Parquet data type: INT_64 |
2 |
|
action |
The action that is associated with the traffic:
Parquet data type: STRING |
2 |
|
log-status |
The logging status of the flow log:
Parquet data type: STRING |
2 |
|
vpc-id |
The ID of the VPC that contains the network interface for which the traffic is recorded. Parquet data type: STRING |
3 |
|
subnet-id |
The ID of the subnet that contains the network interface for which the traffic is recorded. Parquet data type: STRING |
3 |
|
instance-id |
The ID of the instance that's associated with network interface for which the traffic is recorded, if the instance is owned by you. Returns a '-' symbol for a requester-managed network interface; for example, the network interface for a NAT gateway. Parquet data type: STRING |
3 |
|
tcp-flags |
The bitmask value for the following TCP flags:
TCP flags can be OR-ed during the aggregation interval. For short connections, the flags might be set on the same line in the flow log record, for example, 19 for SYN-ACK and FIN, and 3 for SYN and FIN. For an example, see TCP flag sequence. For
general information about TCP flags (such as the meaning of
flags like FIN, SYN, and ACK), see TCP segment structure Parquet data type: INT_32 |
3 |
|
type |
The type of traffic. The possible values are: IPv4 | IPv6 | EFA. For more information, see Elastic Fabric Adapter. Parquet data type: STRING |
3 |
|
pkt-srcaddr |
The packet-level (original) source IP address of the traffic. Use this field with the srcaddr field to distinguish between the IP address of an intermediate layer through which traffic flows, and the original source IP address of the traffic. For example, when traffic flows through a network interface for a NAT gateway, or where the IP address of a pod in Amazon EKS is different from the IP address of the network interface of the instance node on which the pod is running (for communication within a VPC). Parquet data type: STRING |
3 |
|
pkt-dstaddr |
The packet-level (original) destination IP address for the traffic. Use this field with the dstaddr field to distinguish between the IP address of an intermediate layer through which traffic flows, and the final destination IP address of the traffic. For example, when traffic flows through a network interface for a NAT gateway, or where the IP address of a pod in Amazon EKS is different from the IP address of the network interface of the instance node on which the pod is running (for communication within a VPC). Parquet data type: STRING |
3 |
|
region |
The Region that contains the network interface for which traffic is recorded. Parquet data type: STRING |
4 |
|
az-id |
The ID of the Availability Zone that contains the network interface for which traffic is recorded. If the traffic is from a sublocation, the record displays a '-' symbol for this field. Parquet data type: STRING |
4 |
|
sublocation-type |
The type of sublocation that's returned in the
sublocation-id field. The possible values are:
wavelength Parquet data type: STRING |
4 |
|
sublocation-id |
The ID of the sublocation that contains the network interface for which traffic is recorded. If the traffic is not from a sublocation, the record displays a '-' symbol for this field. Parquet data type: STRING |
4 |
|
pkt-src-aws-service |
The name of the subset of IP address ranges for the pkt-srcaddr field, if the source IP address is for an AWS service. If the pkt-srcaddr belongs to an overlapped range, pkt-src-aws-service will only show one of the AWS service code. The possible values are: AMAZON | AMAZON_APPFLOW | AMAZON_CONNECT | API_GATEWAY | CHIME_MEETINGS | CHIME_VOICECONNECTOR | CLOUD9 | CLOUDFRONT | CODEBUILD | DYNAMODB | EBS | EC2 | EC2_INSTANCE_CONNECT | GLOBALACCELERATOR | KINESIS_VIDEO_STREAMS | ROUTE53 | ROUTE53_HEALTHCHECKS | ROUTE53_HEALTHCHECKS_PUBLISHING | ROUTE53_RESOLVER | S3 | WORKSPACES_GATEWAYS. Parquet data type: STRING |
5 |
|
pkt-dst-aws-service |
The name of the subset of IP address ranges for the pkt-dstaddr field, if the destination IP address is for an AWS service. For a list of possible values, see the pkt-src-aws-service field. Parquet data type: STRING |
5 |
|
flow-direction |
The direction of the flow with respect to the interface where traffic is captured. The possible values are: ingress | egress. Parquet data type: STRING |
5 |
|
traffic-path |
The path that egress traffic takes to the destination. To determine whether the traffic is egress traffic, check the flow-direction field. The possible values are as follows. If none of the values apply, the field is set to -.
Parquet data type: INT_32 |
5 |
|
ecs-cluster-arn |
AWS Resource Name (ARN) of the ECS cluster if the traffic is from a running ECS task. To include this field in your subscription, you need permission to call ecs:ListClusters. Parquet data type: STRING |
7 |
|
ecs-cluster-name |
Name of the ECS cluster if the traffic is from a running ECS task. To include this field in your subscription, you need permission to call ecs:ListClusters. Parquet data type: STRING |
7 |
|
ecs-container-instance-arn |
ARN of the ECS container instance if the traffic is from a running ECS task on an EC2 instance. If the capacity provider is AWS Fargate, this field will be '-'. To include this field in your subscription, you need permission to call ecs:ListClusters and ecs:ListContainerInstances. Parquet data type: STRING |
7 |
|
ecs-container-instance-id |
ID of the ECS container instance if the traffic is from a running ECS task on an EC2 instance. If the capacity provider is AWS Fargate, this field will be '-'. To include this field in your subscription, you need permission to call ecs:ListClusters and ecs:ListContainerInstances. Parquet data type: STRING |
7 |
|
ecs-container-id |
Docker runtime ID of the container if the traffic is from a running ECS task. If there are one or more containers in the ECS task, this will be the docker runtime ID of the first container. To include this field in your subscription, you need permission to call ecs:ListClusters. Parquet data type: STRING |
7 |
|
ecs-second-container-id |
Docker runtime ID of the container if the traffic is from a running ECS task. If there are more than one containers in the ECS task, this will be the Docker runtime ID of the second container. To include this field in your subscription, you need permission to call ecs:ListClusters. Parquet data type: STRING |
7 |
|
ecs-service-name |
Name of the ECS service if the traffic is from a running ECS task and the ECS task is started by an ECS service. If the ECS task is not started by an ECS service, this field will be '-'. To include this field in your subscription, you need permission to call ecs:ListClusters and ecs:ListServices. Parquet data type: STRING |
7 |
|
ecs-task-definition-arn |
ARN of the ECS task definition if the traffic is from a running ECS task. To include this field in your subscription, you need permission to call ecs:ListClusters and ecs:ListTaskDefinitions Parquet data type: STRING |
7 |
|
ecs-task-arn |
ARN of the ECS task if the traffic is from a running ECS task. To include this field in your subscription, you need permission to call ecs:ListClusters and ecs:ListTasks. Parquet data type: STRING |
7 |
|
ecs-task-id |
ID of the ECS task if the traffic is from a running ECS task. To include this field in your subscription, you need permission to call ecs:ListClusters and ecs:ListTasks. Parquet data type: STRING |
7 |
Flow log limitations
To use flow logs, you need to be aware of the following limitations:
-
You can't enable flow logs for VPCs that are peered with your VPC unless the peer VPC is in your account.
-
After you create a flow log, you cannot change its configuration or the flow log record format. For example, you can't associate a different IAM role with the flow log, or add or remove fields in the flow log record. Instead, you can delete the flow log and create a new one with the required configuration.
-
If your network interface has multiple IPv4 addresses and traffic is sent to a secondary private IPv4 address, the flow log displays the primary private IPv4 address in the
dstaddrfield. To capture the original destination IP address, create a flow log with thepkt-dstaddrfield. -
If traffic is sent to a network interface and the destination is not any of the network interface's IP addresses, the flow log displays the primary private IPv4 address in the
dstaddrfield. To capture the original destination IP address, create a flow log with thepkt-dstaddrfield. -
If traffic is sent from a network interface and the source is not any of the network interface's IP addresses, the flow log displays the primary private IPv4 address in the
srcaddrfield. To capture the original source IP address, create a flow log with thepkt-srcaddrfield. -
If traffic is sent to or sent from a network interface, the
srcaddranddstaddrfields in the flow log always display the primary private IPv4 address, regardless of the packet source or destination. To capture the packet source or destination, create a flow log with thepkt-srcaddrandpkt-dstaddrfields. -
When your network interface is attached to a Nitro-based instance, the aggregation interval is always 1 minute or less, regardless of the specified maximum aggregation interval.
Flow logs do not capture all IP traffic. The following types of traffic are not logged:
-
Traffic generated by instances when they contact the Amazon DNS server. If you use your own DNS server, then all traffic to that DNS server is logged.
-
Traffic generated by a Windows instance for Amazon Windows license activation.
-
Traffic to and from
169.254.169.254for instance metadata. -
Traffic to and from
169.254.169.123for the Amazon Time Sync Service. -
DHCP traffic.
-
Mirrored traffic.
-
Traffic to the reserved IP address for the default VPC router.
-
Traffic between an endpoint network interface and a Network Load Balancer network interface.
Limitations specific to ECS fields available in version 7:
To create flow log subscriptions with ECS fields, your account must contain at least one ECS cluster.
ECS fields are not computed if the underlying ECS tasks are not owned by the owner of the flow log subscription. For example, if you share a subnet (
SubnetA) with another account (AccountB), and then you create a flow log subscription forSubnetA, ifAccountBlaunches ECS tasks in the shared subnet, your subscription will receive traffic logs from ECS tasks launched byAccountBbut the ECS fields for these logs will not be computed due to security concerns.If you create flow log subscriptions with ECS fields at the VPC/Subnet resource level, any traffic generated for non-ECS network interfaces will also be delivered for your subscriptions. The values for ECS fields will be '-' for non-ECS IP traffic. For example, you have a subnet (
subnet-000000) and you create a flow log subscription for this subnet with ECS fields (fl-00000000). Insubnet-000000, you launch an EC2 instance (i-0000000) that is connected to the internet and is actively generating IP traffic. You also launch a running ECS task (ECS-Task-1) in the same subnet. Since bothi-0000000andECS-Task-1are generating IP traffic, your flow log subscriptionfl-00000000will deliver traffic logs for both entities. However, onlyECS-Task-1will have actual ECS metadata for the ECS fields you included in your logFormat. Fori-0000000related traffic, these fields will have a value of '-'.ecs-container-idandecs-second-container-idare ordered as the VPC Flow Logs service receives them from the ECS event stream. They are not guaranteed to be in the same order as you see them on ECS console or in the DescribeTask API call. If a container enters a STOPPED status while the task is still running, it may continue to appear in your log.The ECS metadata and IP traffic logs are from two different sources. We start computing your ECS traffic as soon as we obtain all required information from upstream dependencies. After you start a new task, we start computing your ECS fields 1) when we receive IP traffic for the underlying network interface and 2) when we receive the ECS event that contains the metadata for your ECS task to indicate the task is now running. After you stop a task, we stop computing your ECS fields 1) when we no longer receive IP traffic for the underlying network interface or we receive IP traffic that is delayed for more than one day and 2) when we receive the ECS event that contains the metadata for your ECS task to indicate your task is no longer running.
Only ECS tasks launched in
awsvpcnetwork mode are supported.
Pricing
Data ingestion and archival charges for vended logs apply when you publish flow logs.
For more information about pricing when publishing vended logs, open Amazon CloudWatch Pricing
To track charges from publishing flow logs, you can apply cost allocation tags to your destination resource. Thereafter, your AWS cost allocation report includes usage and costs aggregated by these tags. You can apply tags that represent business categories (such as cost centers, application names, or owners) to organize your costs. For more information, see the following:
-
Using Cost Allocation Tags in the AWS Billing User Guide
-
Tag log groups in Amazon CloudWatch Logs in the Amazon CloudWatch Logs User Guide
-
Using cost allocation S3 bucket tags in the Amazon Simple Storage Service User Guide
-
Tagging Your Delivery Streams in the Amazon Data Firehose Developer Guide
