Monitor GPUs with CloudWatch
When you use your DLAMI with a GPU you might find that you are looking for ways to track its usage during training or inference. This can be useful for optimizing your data pipeline, and tuning your deep learning network.
There are two ways to configure GPU metrics with CloudWatch:
Configure metrics with the AWS CloudWatch agent (Recommended)
Integrate your DLAMI with the unified CloudWatch agent to configure GPU metrics and monitor the utilization of GPU coprocesses in Amazon EC2 accelerated instances.
There are four ways to configure GPU metrics with your DLAMI:
For information on updates and security patches, see Security patching for the AWS CloudWatch agent
Prerequisites
To get started, you must configure Amazon EC2 instance IAM permissions that allow your instance to push metrics to CloudWatch. For detailed steps, see Create IAM roles and users for use with the CloudWatch agent.
Configure minimal GPU metrics
Configure minimal GPU metrics using the dlami-cloudwatch-agent@minimal systemd service.
This service configures the following metrics:
utilization_gpuutilization_memory
You can find the systemd service for minimal preconfigured GPU metrics in the following location:
/opt/aws/amazon-cloudwatch-agent/etc/dlami-amazon-cloudwatch-agent-minimal.json
Enable and start the systemd service with the following commands:
sudo systemctl enable dlami-cloudwatch-agent@minimal
sudo systemctl start dlami-cloudwatch-agent@minimal
Configure partial GPU metrics
Configure partial GPU metrics using the dlami-cloudwatch-agent@partial systemd service.
This service configures the following metrics:
utilization_gpuutilization_memorymemory_totalmemory_usedmemory_free
You can find the systemd service for partial preconfigured GPU metrics in the following location:
/opt/aws/amazon-cloudwatch-agent/etc/dlami-amazon-cloudwatch-agent-partial.json
Enable and start the systemd service with the following commands:
sudo systemctl enable dlami-cloudwatch-agent@partial
sudo systemctl start dlami-cloudwatch-agent@partial
Configure all available GPU metrics
Configure all available GPU metrics using the dlami-cloudwatch-agent@all systemd service.
This service configures the following metrics:
utilization_gpuutilization_memorymemory_totalmemory_usedmemory_freetemperature_gpupower_drawfan_speedpcie_link_gen_currentpcie_link_width_currentencoder_stats_session_countencoder_stats_average_fpsencoder_stats_average_latencyclocks_current_graphicsclocks_current_smclocks_current_memoryclocks_current_video
You can find the systemd service for all available preconfigured GPU metrics in the following location:
/opt/aws/amazon-cloudwatch-agent/etc/dlami-amazon-cloudwatch-agent-all.json
Enable and start the systemd service with the following commands:
sudo systemctl enable dlami-cloudwatch-agent@all
sudo systemctl start dlami-cloudwatch-agent@all
Configure custom GPU metrics
If the preconfigured metrics do not meet your requirements, you can create a custom CloudWatch agent configuration file.
Create a custom configuration file
To create a custom configuration file, refer to the detailed steps in Manually create or edit the CloudWatch agent configuration file.
For this example, assume that the schema definition is located at /opt/aws/amazon-cloudwatch-agent/etc/amazon-cloudwatch-agent.json.
Configure metrics with your custom file
Run the following command to configure the CloudWatch agent according to your custom file:
sudo /opt/aws/amazon-cloudwatch-agent/bin/amazon-cloudwatch-agent-ctl \
-a fetch-config -m ec2 -s -c \
file:/opt/aws/amazon-cloudwatch-agent/etc/amazon-cloudwatch-agent.json
Security patching for the AWS CloudWatch agent
Newly released DLAMIs are configured with the latest available AWS CloudWatch agent security patches. Refer to the following sections to update your current DLAMI with the latest security patches depending on your operating system of choice.
Amazon Linux 2
Use yum to get the latest AWS CloudWatch agent security patches for an Amazon Linux 2 DLAMI.
sudo yum update
Ubuntu
To get the latest AWS CloudWatch security patches for a DLAMI with Ubuntu, it is necessary to reinstall the AWS CloudWatch agent using an Amazon S3 download link.
wget https://s3.region.amazonaws.com/amazoncloudwatch-agent-region/ubuntu/arm64/latest/amazon-cloudwatch-agent.deb
For more information on installing the AWS CloudWatch agent using Amazon S3 download links, see Installing and running the CloudWatch agent on your servers.
Configure metrics with the preinstalled gpumon.py script
A utility called gpumon.py is preinstalled on your DLAMI. It integrates with CloudWatch and supports monitoring of per-GPU usage: GPU memory, GPU temperature, and GPU Power. The script periodically sends the monitored data to CloudWatch. You can configure the level of granularity for data being sent to CloudWatch by changing a few settings in the script. Before starting the script, however, you will need to setup CloudWatch to receive the metrics.
How to setup and run GPU monitoring with CloudWatch
-
Create an IAM user, or modify an existing one to have a policy for publishing the metric to CloudWatch. If you create a new user please take note of the credentials as you will need these in the next step.
The IAM policy to search for is “cloudwatch:PutMetricData”. The policy that is added is as follows:
Tip
For more information on creating an IAM user and adding policies for CloudWatch, refer to the CloudWatch documentation.
-
On your DLAMI, run AWS configure and specify the IAM user credentials.
$aws configure -
You might need to make some modifications to the gpumon utility before you run it. You can find the gpumon utility and README in the location defined in the following code block. For more information on the
gpumon.pyscript, see the Amazon S3 location of the script.Folder: ~/tools/GPUCloudWatchMonitor Files: ~/tools/GPUCloudWatchMonitor/gpumon.py ~/tools/GPUCloudWatchMonitor/READMEOptions:
-
Change the region in gpumon.py if your instance is NOT in us-east-1.
-
Change other parameters such as the CloudWatch
namespaceor the reporting period withstore_reso.
-
-
Currently the script only supports Python 3. Activate your preferred framework’s Python 3 environment or activate the DLAMI general Python 3 environment.
$source activate python3 -
Run the gpumon utility in background.
(python3)$python gpumon.py & -
Open your browser to the https://console.aws.amazon.com/cloudwatch/
then select metric. It will have a namespace 'DeepLearningTrain'. Tip
You can change the namespace by modifying gpumon.py. You can also modify the reporting interval by adjusting
store_reso.
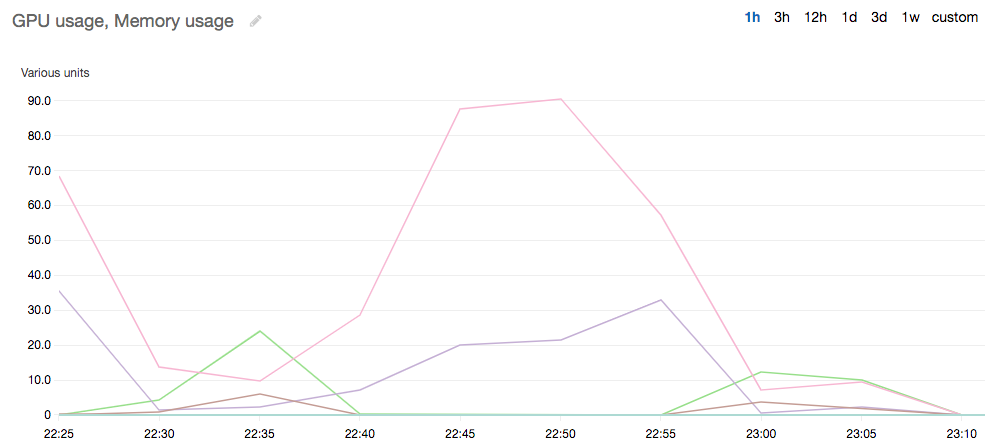
The following is an example CloudWatch chart reporting on a run of gpumon.py monitoring a training job on p2.8xlarge instance.
You might be interested in these other topics on GPU monitoring and optimization:
-
-
Monitor GPUs with CloudWatch
-
