Measuring Performance Between Your Gateway and AWS
Data throughput, data latency, and operations per second are three measures that you can use to understand how your application storage using the Storage Gateway is performing. These three values can be measured using the Storage Gateway metrics provided for you when you use the correct aggregation statistic. The following table summarizes the metrics and corresponding statistic to use to measure the throughput, latency, and input/output operations per second (IOPS) between your gateway and AWS.
| Item of Interest | How to Measure |
|---|---|
| Throughput |
Use the |
| Latency | Use the ReadTime and WriteTime metrics with
the Average CloudWatch statistic. For example, the
Average value of the ReadTime metric gives
you the latency per operation over the sample period of time. |
| IOPS | Use the ReadBytes and WriteBytes metrics
with the Samples CloudWatch statistic. For example, the
Samples value of the ReadBytes metric over
a sample period of 5 minutes divided by 300 seconds gives you IOPS.
|
| Throughput to AWS | Use the CloudBytesDownloaded and
CloudBytesUploaded metrics with the Sum
CloudWatch statistic. For example, the Sum value of the
CloudBytesDownloaded metric over a sample period of 5
minutes divided by 300 seconds gives you the throughput from AWS to
the gateway as bytes per second. |
| Latency of data to AWS | Use the CloudDownloadLatency metric with the
Average statistic. For example, the
Average statistic of the
CloudDownloadLatency metric gives you the latency per
operation. |
To measure the upload data throughput from a gateway to AWS
Open the CloudWatch console at https://console.aws.amazon.com/cloudwatch/
. -
Choose Metrics, then choose the All metrics tab and then choose Storage Gateway.
-
Choose the Gateway metrics dimension, and find the volume that you want to work with.
-
Choose the
CloudBytesUploadedmetric. -
For Time Range, choose a value.
-
Choose the
Sumstatistic. -
For Period, choose a value of 5 minutes or greater.
-
In the resulting time-ordered set of data points, divide each data point by the period (in seconds) to get the throughput at that sample period.
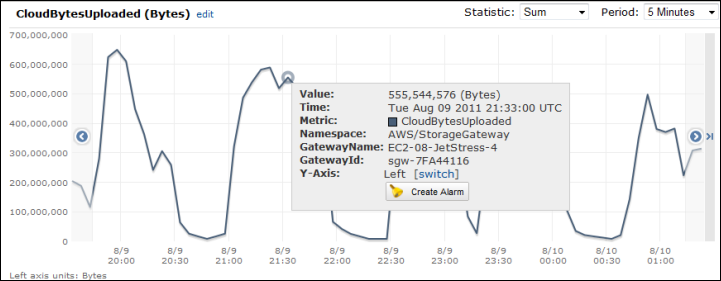
Moving the cursor over a data point displays information about the data point, including its value and bytes uploaded. Divide this value by the Period value (5 minutes) to get the throughput at that sample point. For example, if the throughput from the gateway to AWS is 555,544,576 bytes over a period of 300 seconds, then the approximate throughput per second is 1.85 megabytes per second.
To measure the latency per operation of a gateway
Open the CloudWatch console at https://console.aws.amazon.com/cloudwatch/
. -
Choose Metrics, then choose the All metrics tab and then choose Storage Gateway.
-
Choose the Gateway metrics dimension, and find the volume that you want to work with.
-
Choose the
ReadTimeandWriteTimemetrics. -
For Time Range, choose a value.
-
Choose the
Averagestatistic. -
For Period, choose a value of 5 minutes to match the default reporting time.
-
In the resulting time-ordered set of points (one for
ReadTimeand one forWriteTime), add data points at the same time sample to get to the total latency in milliseconds.
To measure the data latency from a gateway to AWS
Open the CloudWatch console at https://console.aws.amazon.com/cloudwatch/
. -
Choose Metrics, then choose the All metrics tab and then choose Storage Gateway.
-
Choose the Gateway metrics dimension, and find the volume that you want to work with.
-
Choose the
CloudDownloadLatencymetric. -
For Time Range, choose a value.
-
Choose the
Averagestatistic. -
For Period, choose a value of 5 minutes to match the default reporting time.
The resulting time-ordered set of data points contains the latency in milliseconds.
To set an upper threshold alarm for a gateway's throughput to AWS
Open the CloudWatch console at https://console.aws.amazon.com/cloudwatch/
. -
Choose Alarms.
-
Choose Create Alarm to start the Create Alarm wizard.
-
Choose the Storage Gateway dimension, and find the gateway that you want to work with.
-
Choose the
CloudBytesUploadedmetric. -
To define the alarm, define the alarm state when the
CloudBytesUploadedmetric is greater than or equal to a specified value for a specified time. For example, you can define an alarm state when theCloudBytesUploadedmetric is greater than 10 MB for 60 minutes. -
Configure the actions to take for the alarm state. For example, you can have an email notification sent to you.
-
Choose Create Alarm.
To set an upper threshold alarm for reading data from AWS
Open the CloudWatch console at https://console.aws.amazon.com/cloudwatch/
. -
Choose Create Alarm to start the Create Alarm wizard.
-
Choose the StorageGateway: Gateway Metrics dimension, and find the gateway that you want to work with.
-
Choose the
CloudDownloadLatencymetric. -
Define the alarm by defining the alarm state when the
CloudDownloadLatencymetric is greater than or equal to a specified value for a specified time. For example, you can define an alarm state when theCloudDownloadLatencyis greater than 60,000 milliseconds for greater than 2 hours. -
Configure the actions to take for the alarm state. For example, you can have an email notification sent to you.
-
Choose Create Alarm.
