Tracing for your App Runner application with X-Ray
AWS X-Ray is a service that collects data about requests that your application serves, and provides tools you can use to view, filter, and gain insights into that data to identify issues and opportunities for optimization. For any traced request to your application, you can see detailed information not only about the request and response, but also about calls that your application makes to downstream AWS resources, microservices, databases and HTTP web APIs.
X-Ray uses trace data from the AWS resources that power your cloud applications to generate a detailed service graph. The service graph shows the client, your front-end service, and backend services that your front-end service calls to process requests and persist data. Use the service graph to identify bottlenecks, latency spikes, and other issues to solve to improve the performance of your applications.
For more information about X-Ray, see the AWS X-Ray Developer Guide.

Instrument your application for tracing
Instrument your App Runner service application for tracing using OpenTelemetry
Depending on the specific ADOT SDK that you use in your application, ADOT supports up to two instrumentation approaches: automatic
and manual. For more information about instrumentation with your SDK, see the ADOT documentation
Runtime setup
The following are the general runtime setup instructions to instrument your App Runner service application for tracing.
To setup tracing for your runtime
-
Follow the instructions provided for your runtime in AWS Distro for OpenTelemetry
(ADOT), to instrument your application. -
Install the required
OTELdependencies in thebuildsection of theapprunner.yamlfile if you are using the source code repository or in the Dockerfile if you are using a container image. -
Setup your environment variables in the
apprunner.yamlfile if you are using the source code repository or in the Dockerfile if you are using a container image.Example Environment variables
Note
The following example lists the important environment variables to add to the
apprunner.yamlfile. Add these environment variables to your Dockerfile if you are using a container image. However, each runtime can have their own idiosyncrasies and you may need to add more environment variables to the following list. For more information on your runtime specific instructions and examples on how to setup your application for your runtime, see AWS Distro for OpenTelemetryand go to your runtime, under Getting Started. env: - name: OTEL_PROPAGATORS value: xray - name: OTEL_METRICS_EXPORTER value: none - name: OTEL_EXPORTER_OTLP_ENDPOINT value: http://localhost:4317 - name: OTEL_RESOURCE_ATTRIBUTES value: 'service.name=example_app'Note
OTEL_METRICS_EXPORTER=noneis an important environment variable for App Runner since the App Runner Otel collector doesn't accept metrics logging. It only accepts metrics tracing.
Runtime setup example
The following example demonstrates auto-instrumenting your application with the ADOT Python SDK
First, add some dependencies, as shown in the following example.
Example requirements.txt
opentelemetry-distro[otlp]>=0.24b0
opentelemetry-sdk-extension-aws~=2.0
opentelemetry-propagator-aws-xray~=1.0
Then, instrument your application. The way to do it depends on your service source—source image or source code.
Add X-Ray permissions to your App Runner service instance role
To use X-Ray tracing with your App Runner service, you have to provide the service's instances with permissions to interact with the X-Ray service. You do
this by associating an instance role with your service and adding a managed policy with X-Ray permissions. For more information about an App Runner instance
role, see Instance role. Add the AWSXRayDaemonWriteAccess managed policy to your
instance role and assign it to your service during creation.
Enable X-Ray tracing for your App Runner service
When you create a service, App Runner disables tracing by default. You can enable X-Ray tracing for your service as part of configuring observability. For more information, see Manage observability.
If you use the App Runner API or the AWS CLI, the TraceConfiguration object within the ObservabilityConfiguration resource object contains tracing settings. To keep tracing
disabled, don't specify a TraceConfiguration object.
In both the console and API cases, be sure to associate your instance role discussed in the previous section with your App Runner service.
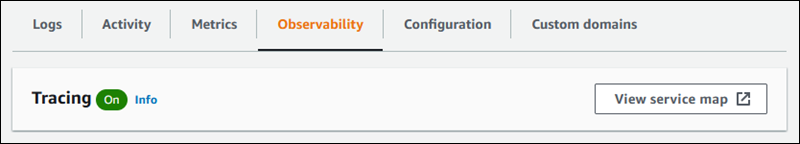
View X-Ray tracing data for your App Runner service
On the Observability tab of the service dashboard page in the App Runner console, choose View service map to navigate to the Amazon CloudWatch console.
Use the Amazon CloudWatch console to view service maps and traces for requests that your application serves. Service maps show information like request latency and interactions with other applications and AWS services. The custom annotations that you add to your code allow you to easily search for traces. For more information, see Using ServiceLens to monitor the health of your applications in the Amazon CloudWatch User Guide.
