Viewing traces and trace details
Use the Traces page in the X-Ray console to find traces by URL,
response code, or other data from the trace summary. After selecting a trace from the trace
list, the Trace details page displays a map of service nodes that are
associated with the selected trace and a timeline of trace segments.
Viewing traces
- CloudWatch console
-
To view traces in the CloudWatch console
Sign in to the AWS Management Console and open the CloudWatch console at
https://console.aws.amazon.com/cloudwatch/.
-
In the left navigation pane, choose X-Ray traces, then
choose Traces. You can filter by group or enter a filter expression. This filters the traces
that are displayed in the Traces section at the bottom of the
page.
Alternatively, you can use the service map to navigate to a specific service
node, and then view traces. This opens the Traces page with a
query already applied.
-
Refine your query in the Query refiners section. To filter
traces by a common attribute, choose an option from the down arrow next to
Refine query by. The options include the following:
-
Node – Filter traces by service node.
-
Resource ARN – Filter traces by a resource associated with a trace.
Examples of these resources include Amazon Elastic Compute Cloud (Amazon EC2) instance, an AWS Lambda
function, or an Amazon DynamoDB table.
-
User – Filter traces with a user ID.
-
Error root cause message – Filter traces by error root cause.
-
URL – Filter traces by a URL path used by your application.
-
HTTP status code – Filter traces by the HTTP status code returned by
your application. You can specify a custom response code or select from the
following:
-
200 – The request was successful.
-
401 – The request lacked valid authentication
credentials.
-
403 – The request lacked valid permissions.
-
404 – The server could not find the requested
resource.
-
500 – The server encountered an unexpected condition
and generated an internal error.
Choose one or more entries and then choose Add to query to
add to the filter expression at the top of the page.
-
To find a single trace, enter a trace
ID directly into the query field. You can use X-Ray format or World Wide
Web Consortium (W3C) format. For example, a trace that's created using the AWS Distro for OpenTelemetry is in W3C format.
When you query traces that are created with a W3C-format trace ID, the console
displays the matching trace in X-Ray format. For example, if you query for
4efaaf4d1e8720b39541901950019ee5 in W3C format, the console
displays the X-Ray equivalent:
1-4efaaf4d-1e8720b39541901950019ee5.
-
Choose Run query at any time to display a list of matching
traces within the Traces section at the bottom of the page.
-
To display the Trace details page for a single trace,
select a trace ID from the list.
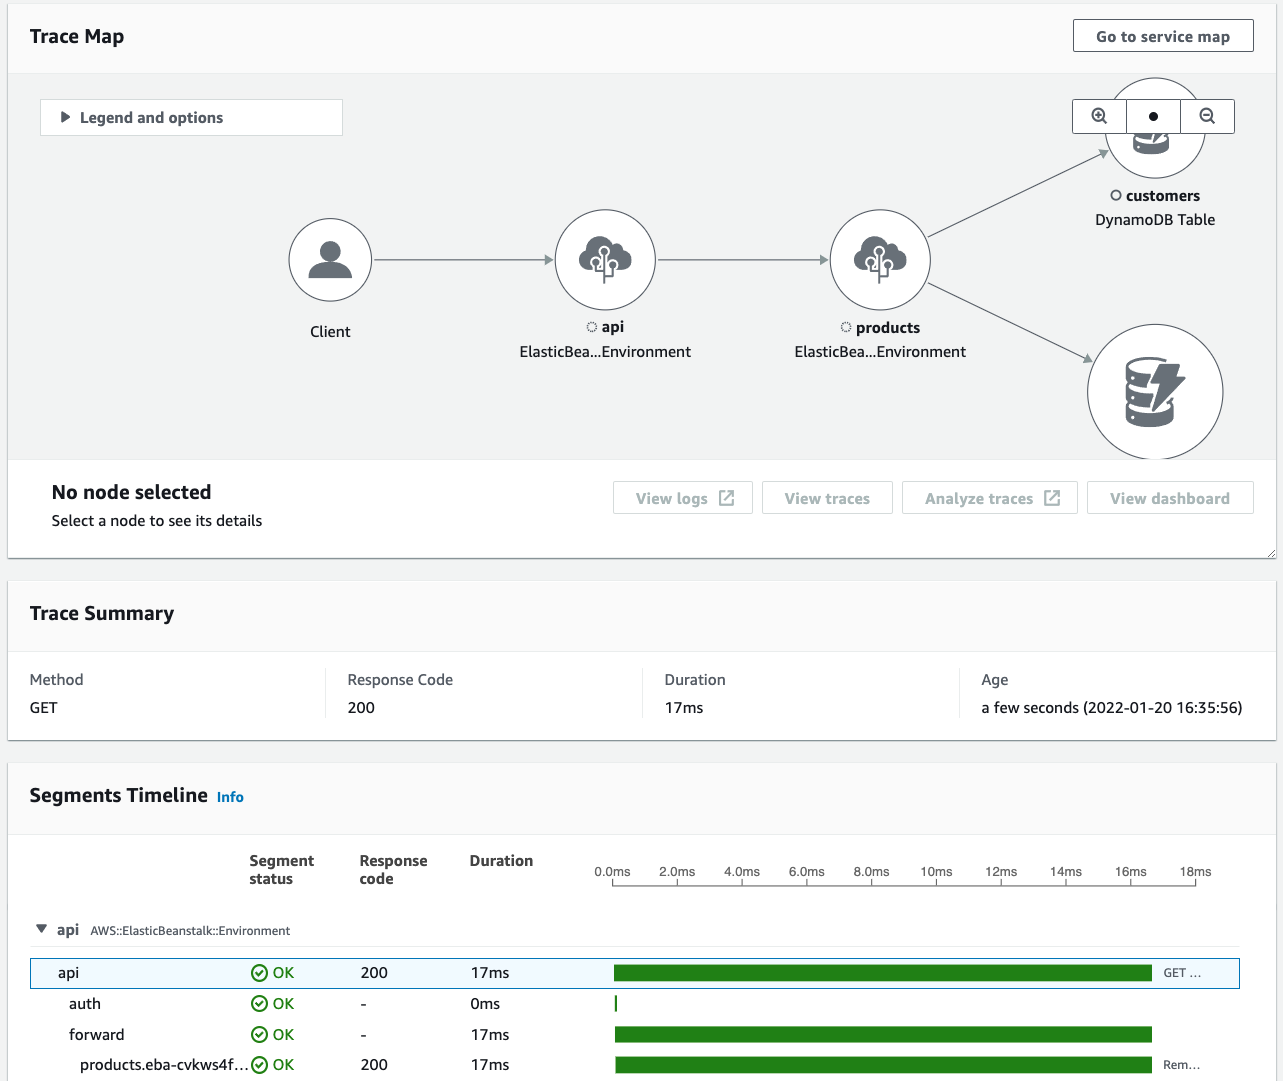
The following image shows a Trace map containing service
nodes associated with the trace and edges between the nodes representing the path
taken by segments that compose the trace. A Trace summary
follows the Trace Map. The summary contains information about a
sample GET operation, its Response Code, the
Duration that the trace took to run, and the
Age of the request. The Segments
Timeline follows the Trace Summary that shows the
duration of trace segments and subsegments.
If you have an event-driven application that uses Amazon SQS and Lambda, you can see a
connected view of traces for each request in the Trace map. In
the map, traces from message producers are linked to traces from AWS Lambda consumers
and are displayed as a dashed-line edge. For more information about event-driven
applications, see Tracing event-driven applications.
The Traces and Trace details pages
also support cross-account tracing,
which can list traces from multiple accounts in the trace list and inside a single
trace map.
- X-Ray console
-
To view traces in the X-Ray console
-
Open the Traces page in the X-Ray console. The Trace
overview panel shows a list of traces that are grouped by common
features including Error root causes,
ResourceARN, and InstanceId.
-
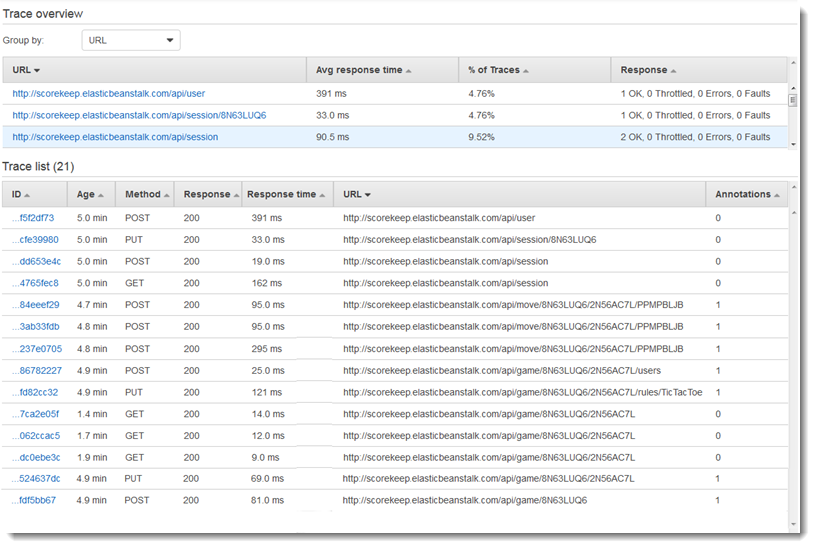
To select a common feature to view a grouped set of traces, expand the down
arrow next to Group by. The following illustration shows a
trace overview of traces that are grouped by URL for the AWS X-Ray sample application, and a list of
associated traces.
-
Choose the ID of a trace to view it under the
Trace list. You can also choose Service
map in the navigation pane to view traces for a specific service node.
Then you can view traces that are associated with that node.
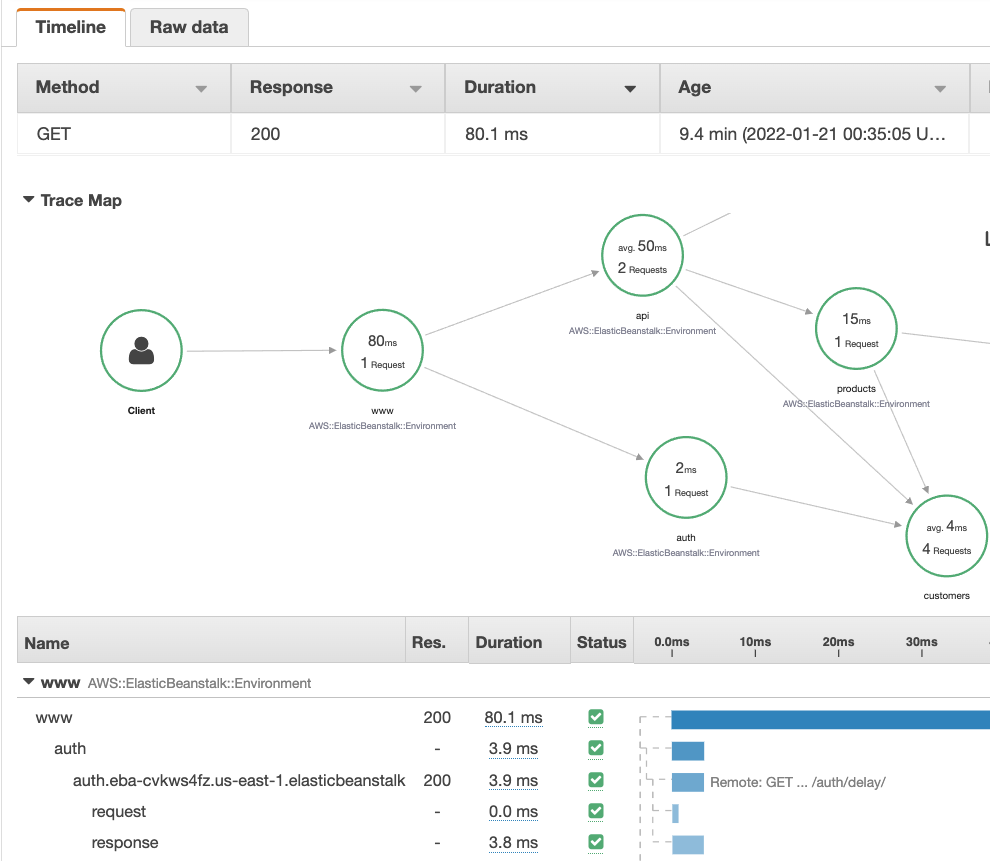
The Timeline tab shows the request flow for the trace, and
includes the following:
-
A map of the path for each segment in the trace.
-
How long it took for the segment to reach a node in the trace map.
-
How many requests were made to the node in the trace map.
The following illustration shows an example Trace Map
associated with a GET request made to a sample application. The arrows
show the path that each segment took to complete the request. The service nodes show
the number of requests made during the GET request.
For more information about the Timeline tab, see the
following Exploring the trace timeline
section.
The Raw data tab shows information about the trace, and the
segments and subsegments that compose the trace, in JSON format. This
information may include the following:
-
Timestamps
-
Unique IDs
-
Resources associated with the segment or subsegment
-
The source, or origin, of the segment or subsegment
-
Additional information about the request to your application such as the
response from an HTTP request
Exploring the trace timeline
The Timeline section shows a hierarchy of segments and subsegments
next to a horizontal bar that corresponds to time they used to complete their tasks. The first
entry in the list is the segment, which represents all data recorded by the service for a
single request. Subsegments are indented and listed following the segment. Columns contain
information about each segment.
- CloudWatch console
-
In the CloudWatch console, the Segments Timeline provides the
following information:
-
The first column: Lists the segments and subsegments in the selected
trace.
-
The Segment status column: Lists the status outcome of each
segment and subsegment.
-
The Response code column: Lists an HTTP response status
code to a browser request made by the segment or subsegment, when available.
-
The Duration column: Lists how long the segment or
subsegment ran.
-
The Hosted in column: Lists the namespace or environment
where the segment or subsegment is ran, if applicable. For more information, see
Dimensions collected and dimension combinations.
-
The last column: Displays horizontal bars that correspond to the duration that
the segment or subsegment ran, in relation to the other segments or subsegments in
the timeline.
To group the list of segments and subsegments by service node, turn on
Group by nodes.
- X-Ray console
-
In the trace details page, choose the Timeline tab to see the
timeline for each segment and subsegment that makes up a trace.
In the X-Ray console, the Timeline provides the following
information:
-
The Name column: Lists the names of the segments and
subsegments in the trace.
-
The Res. column: Lists an HTTP response status code to a
browser request made by the segment or subsegment, when available.
-
The Duration column: Lists how long the segment or
subsegment ran.
-
The Status column: Lists the outcome of the segment or
subsegment status.
-
The last column: Displays horizontal bars that correspond to the duration that
the segment or subsegment ran, in relation to the other segments or subsegments in
the timeline.
To see the raw trace data that the console uses to generate the timeline, choose the
Raw data tab. The raw data shows you information about the trace,
and the segments and subsegments that compose the trace in JSON format.
This information may include the following:
-
Timestamps
-
Unique IDs
-
Resources associated with the segment or subsegment
-
The source, or origin, of the segment or subsegment
-
Additional information about the request to your application such as the
response from an HTTP request.
When you use an instrumented AWS SDK, HTTP, or SQL client
to make calls to external resources, the X-Ray SDK records subsegments automatically. You can
also use the X-Ray SDK to record custom subsegments for any function or block of code.
Additional subsegments that are recorded while a custom subsegment are open become children of
the custom subsegment.
Viewing segment details
From the trace Timeline, choose the name of a segment to view its
details.
The Segment details panel shows the Overview,
Resources, Annotations,
Metadata, Exceptions, and SQL
tabs. The following apply:
-
The Overview tab shows information about the request and
response. Information includes the name, start time, end time, duration, the request URL,
request operation, request response code, and any errors and faults.
-
The Resources tab for a segment shows information from the X-Ray
SDK and about the AWS resources running your application. Use the Amazon EC2, AWS Elastic Beanstalk, or
Amazon ECS plugins for the X-Ray SDK to record service-specific resource information. For more
information about plugins, see the Service plugins
section in Configuring the X-Ray SDK for Java.
-
The remaining tabs show Annotations,
Metadata, and Exceptions that are recorded for
the segment. Exceptions are captured automatically when they are generated from an
instrumented request. Annotations and metadata contain additional information that you
record by using the operations that the X-Ray SDK provides. To add annotations or
metadata to your segments, use the X-Ray SDK. For more information, see the
language-specific link listed under Instrumenting your application with AWS X-Ray SDKs in
Instrumenting your application for AWS X-Ray.
Viewing subsegment details
From the trace timeline, choose the name of a subsegment to view its details:
-
The Overview tab contains information about the request and
response. This includes the name, start time, end time, duration, the request
URL, request operation, request response code, and any errors and faults.
For subsegments generated with instrumented clients, the Overview tab
contains information about the request and response from your application's point of
view.
-
The Resources tab for a subsegment shows details about the AWS
resources that were used to run the subsegment. For example, the resources tab may include
an AWS Lambda function ARN, information about a DynamoDB table, any operation that is called,
and request ID.
-
The remaining tabs show Annotations,
Metadata, and Exceptions recorded on the
subsegment. Exceptions are captured automatically when they are generated from an
instrumented request. Annotations and metadata contain additional information that you
record by using the operations that the X-Ray SDK provides. Use the X-Ray SDK to add
annotations or metadata to your segments. For more information, see the language-specific
link listed under Instrumenting your application with AWS X-Ray
SDKs in Instrumenting your application for AWS X-Ray.
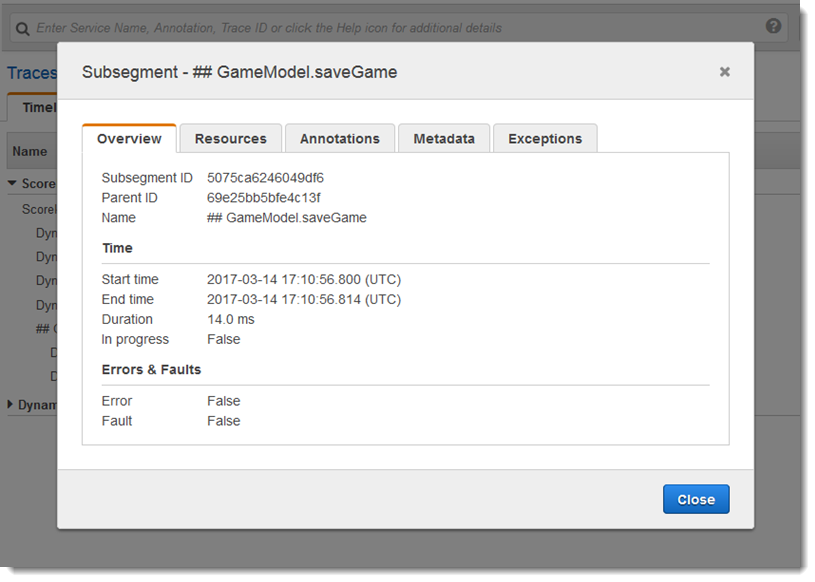
For custom subsegments, the Overview tab shows the name of the
subsegment, which you can set to specify the area of the code or function that it records. For
more information, see the language-specific link listed under Instrumenting your application with AWS X-Ray SDKs in Generating custom subsegments with the X-Ray SDK for Java.
The following image shows the Overview tab for a custom subsegment.
The overview contains the subsegment ID, parent ID, Name, start and end times, duration,
status and errors or faults.
The Metadata tab for a custom subsegment contains information in
JSON format about resources used by that subsegment.