periodToDatePercentileCont
The periodToDatePercentileCont function calculates percentile based on a
continuous distribution of the numbers in the measure for a given time
granularity (for instance, a quarter) up to a point in time in that period. It uses the
grouping and sorting that are applied in the field wells.
To return an exact percentile value that might not be present in your dataset, use periodToDatePercentileCont. To return the nearest percentile value that is present in your dataset, use periodToDatePercentile instead.
Syntax
periodToDatePercentileCont(
	measure,
	percentile,
	dateTime,
	period,
	endDate (optional))
Arguments
- measure
-
The argument must be a field. Null values are omitted from the results. Literal values don't work.
- percentile
-
The percentile value can be any numeric constant 0-100. A percentile of 50 computes the median value of the measure.
- dateTime
-
The Date dimension over which you're computing PeriodToDate aggregations.
- period
-
The time period across which you're computing the computation. Granularity of
YEARmeansYearToDatecomputation,QuartermeansQuarterToDate, and so on. Valid granularities includeYEAR,QUARTER,MONTH,WEEK,DAY,HOUR,MINUTE, andSECONDS. - endDate
-
(Optional) The date dimension that you're ending computing periodToDate aggregations. It defaults to
now()if omitted.
Example
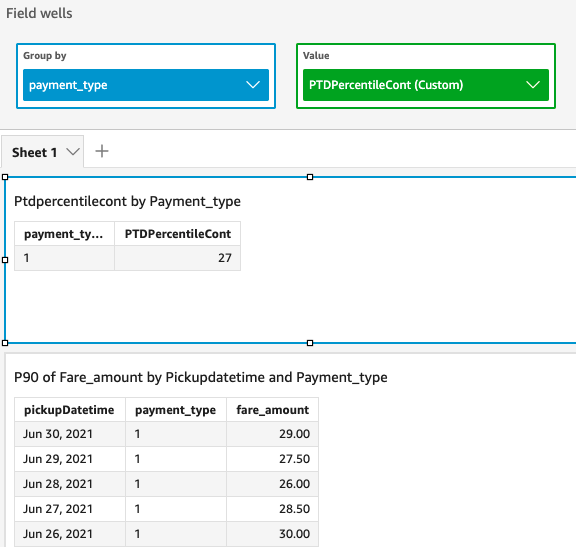
The following example calculates the week-to-date, 90th percentile of fare amount per payment type for the week of 06-30-21. For simplicity in the example, we filtered out only a single payment. 06-30-21 is Wednesday. QuickSight begins the week on Sundays. In our example, that is 06-27-21.
periodToDatePercentileCont(fare_amount, 90, pickupDatetime, WEEK, parseDate("06-30-2021", "MM-dd-yyyy"))